Bitcoin (BTC) Price Hesitates But More Upsides Seem Likely
- There was a slow and steady rise in bitcoin after it tested the $4,920 area against the US Dollar.
- The price climbed higher steadily and broke the $5,200 resistance area to move into a positive zone.
- There is a key ascending channel in place with support at $5,270 on the 4-hours chart of the BTC/USD pair (data feed from Kraken).
- The pair could dip in the short term, but buyers are likely to buy heavily near $5,270 or $5,250.
Bitcoin price is showing positive signs above the $5,200 pivot level against the US Dollar. BTC could accelerate higher once it clears the $5,400 resistance area in the near term.
Bitcoin Price Weekly Analysis (BTC)
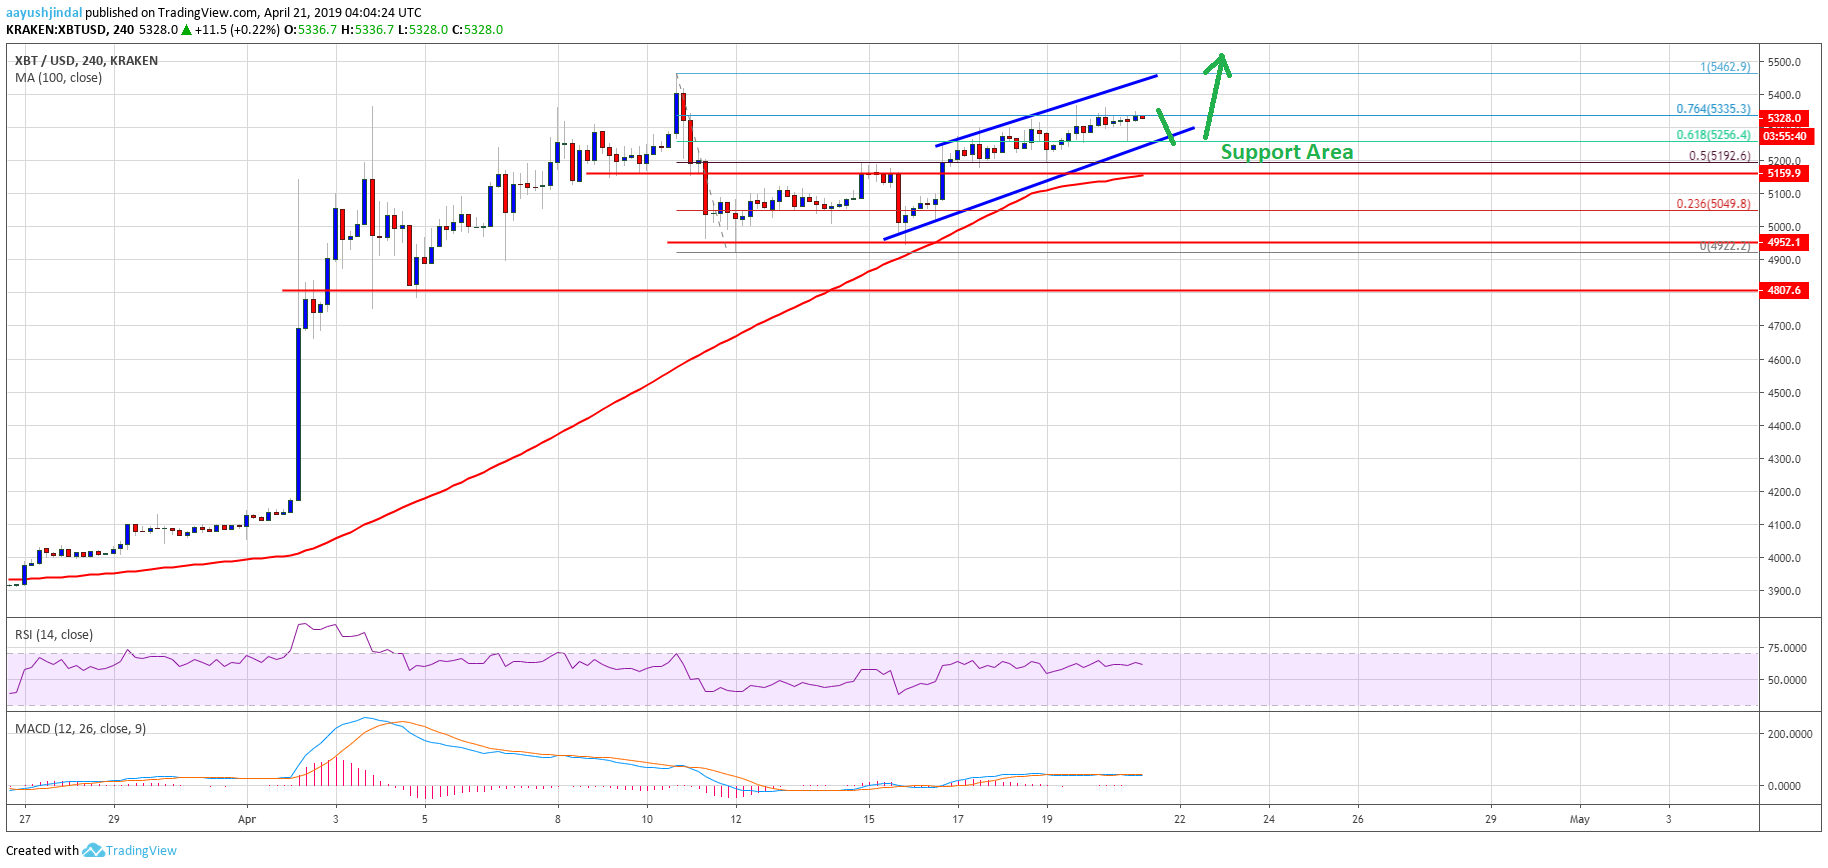
This past week, there was a downside extension below the $5,000 level in bitcoin price against the US Dollar. The BTC/USD pair traded below the $4,950 level before buyers took a stand above the $4,920 level. A swing low was formed at $4,922 and later the price started consolidating in a range. Finally, there was a fresh increase above the $5,160 resistance and the 100 simple moving average (4-hours). The price broke the $5,200 level and the 50% Fib retracement level of the last slide from the $5,462 high to $4,922 low.
The recent upward move was positive since there was a close above the $5,200 and $5,250 levels. However, the price seems to be struggling near the $5,350 resistance. There was also no close above the 76.4% Fib retracement level of the last slide from the $5,462 high to $4,922 low. A successful close above the $5,350 level may perhaps open the doors for more upsides above the $5,400 and $5,450 levels. A break above the last high near $5,462 could trigger a strong upward move towards $5,600 or $5,800.
On the downside, there is a decent support formed above $5,270. There is also a key ascending channel in place with support at $5,270 on the 4-hours chart of the BTC/USD pair. If there is a break below the channel support at $5,270, the price could test the $5,160 support level and the 100 simple moving average (4-hours).

Looking at the chart, bitcoin price is trading nicely above key supports near $5,200. If there is a short term downside correction, buyers are likely to protect $5,270 or $5,200. Only a daily close below $5,160 could put buyers on the back foot. The next key support is at $5,040, followed by the $4,922 swing low.
Technical indicators
4 hours MACD – The MACD for BTC/USD is slightly placed in a bearish zone.
4 hours RSI (Relative Strength Index) – The RSI for BTC/USD is slowly moving lower towards the 50 level.
Major Support Level – $5,160
Major Resistance Level – $5,400
The post Bitcoin (BTC) Price Hesitates But More Upsides Seem Likely appeared first on NewsBTC.
NewsBTChttp://bit.ly/2FUbkJa April 21, 2019 at 01:35AM @BruceDayne, @Aayush Jindal April 21, 2019 at 08:15AM
