Ethereum (ETH) Bulls Are Not out of Woods Yet
- ETH price failed to clear the $170 resistance and extended losses against the US Dollar.
- The price declined to a new weekly low at $155 before correcting above the $160 level.
- There is a key bearish trend line in place with resistance at $166 on the hourly chart of ETH/USD (data feed via Kraken).
- The pair could dip again, but buyers are likely to take a strong stand near $155 or $150.
Ethereum price extended losses recently versus the US Dollar and bitcoin. ETH might remain under pressure in the short term, but it will most likely bounce back from $155 or $150.
Ethereum Price Analysis
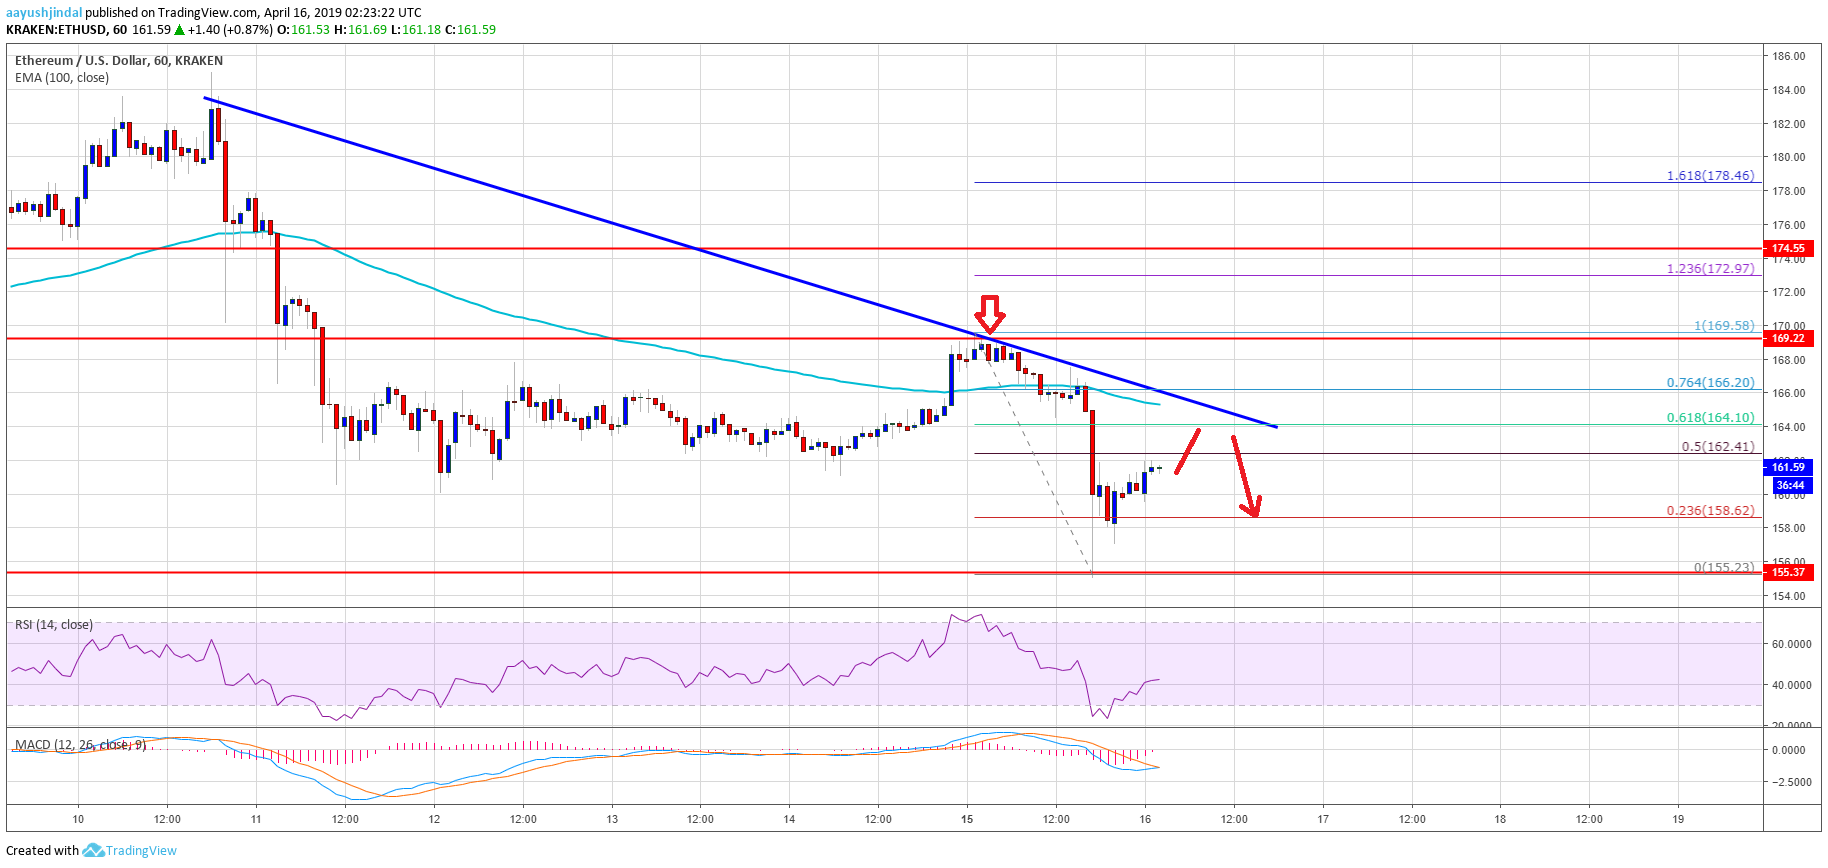
Yesterday, we saw a decent rebound in Ethereum price above the $165 and $166 levels against the US Dollar. The ETH/USD pair even tested the $170 level, where sellers emerged and protected more upsides. There was a topping pattern formed near $170 and later the price started a fresh decline. It broke the $165 and $160 support levels to enter a bearish zone. The decline was such that the price even broke the last swing low at $160 and settled below the 100 hourly simple moving average.
A new weekly low was formed at $155 before the price started a fresh rebound. It recovered above the $160 level and the 23.6% Fib retracement level of the recent decline from the $170 high to $150 low. An immediate resistance is near the $162-163 area. It represents the 50% Fib retracement level of the recent decline from the $170 high to $150 low. Besides, there is a key bearish trend line in place with resistance at $166 on the hourly chart of ETH/USD.
Therefore, if the price corrects higher above $163, it could face sellers near the $166 level. If bulls fail to push the price above the $166 resistance, there could be another decline. On the downside, there are two important supports near $155 and $150. As long as the price is above these supports, there could be a strong comeback above $165 and $170 in the coming days.

Looking at the chart, Ethereum price is showing a few bearish signs below $166 and $170. Therefore, there are high chances of a downside push towards the $155 and $150 levels before a fresh increase. On the upside, a break above the trend line resistance might lead the price towards the $170 resistance area.
ETH Technical Indicators
Hourly MACD – The MACD for ETH/USD is currently placed in the bearish zone, with negative signs.
Hourly RSI – The RSI for ETH/USD bounced back above 35, but it is well below the 50 level.
Major Support Level – $155
Major Resistance Level – $166
The post Ethereum (ETH) Bulls Are Not out of Woods Yet appeared first on NewsBTC.
NewsBTChttp://bit.ly/2FUbkJa April 16, 2019 at 12:15AM @BruceDayne, @Aayush Jindal April 16, 2019 at 03:15AM
