Ethereum Price (ETH) Breaks $220 While Bitcoin Rallied 10%
- ETH price started an upside correction and traded above the $210 resistance against the US Dollar.
- The price gained traction above the $220 level and even traded close to the $230 level.
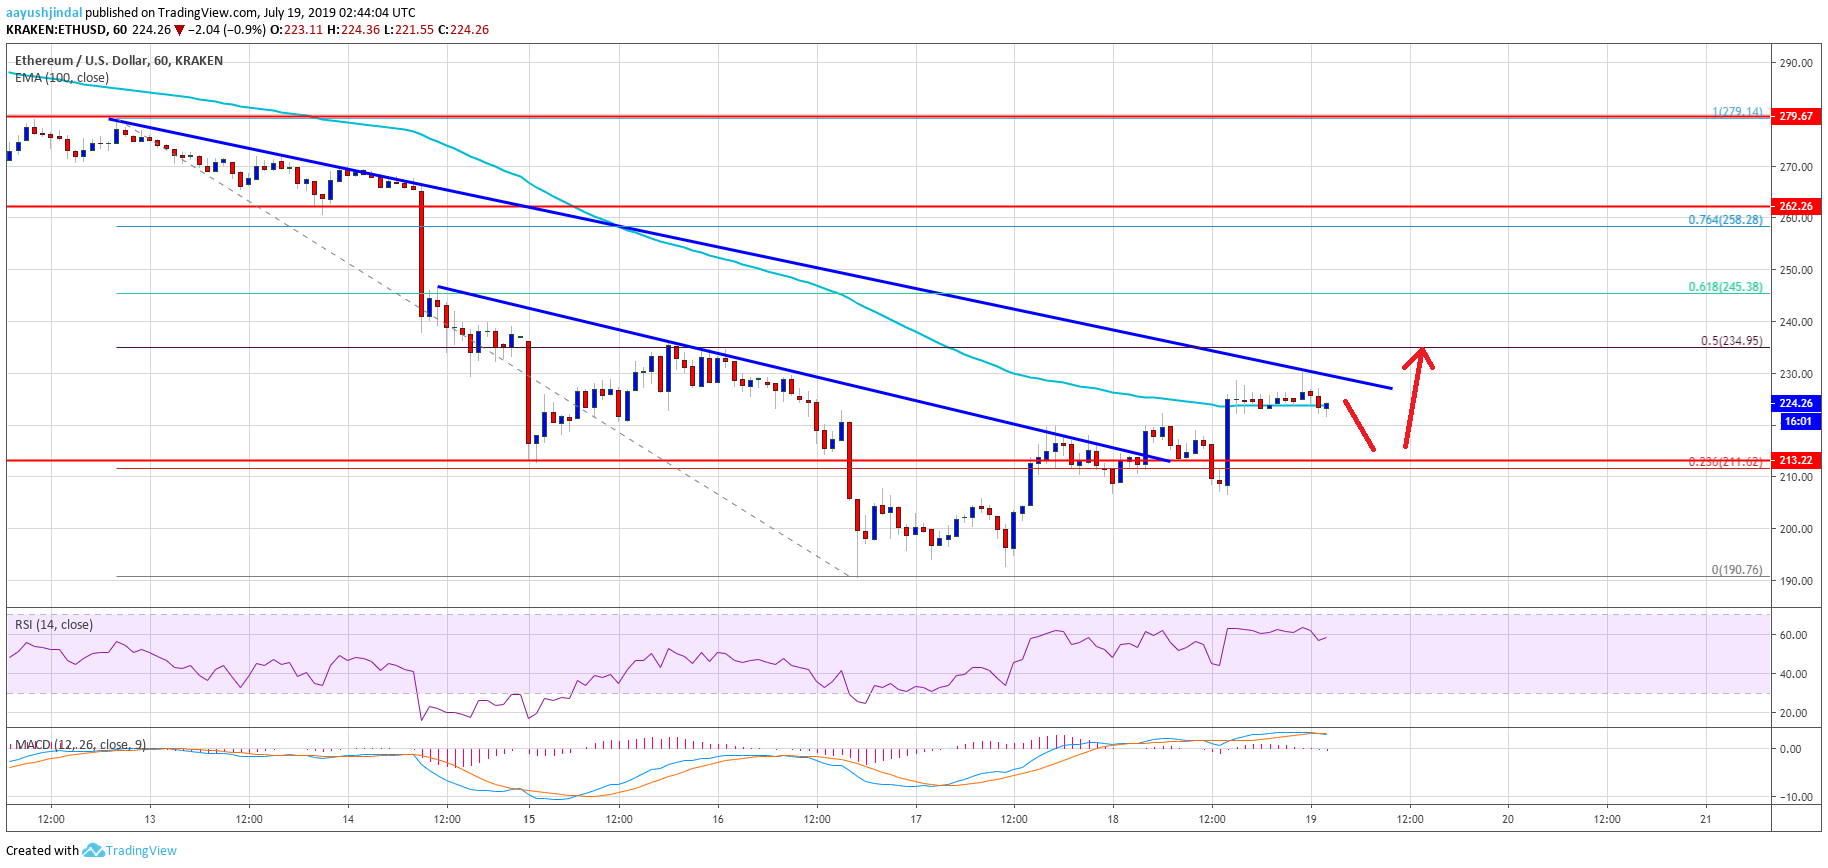
- This week’s followed key bearish trend line is acting as resistance near $230 on the hourly chart of ETH/USD (data feed via Kraken).
- The pair is currently consolidating below the $230 resistance, with support near $212.
Ethereum price is trading with a positive bias above $210 versus the US Dollar, whereas bitcoin jumped 10%. ETH price could dip towards $212 before it could break the $230 resistance.
Ethereum Price Analysis
After a significant decline, Ethereum price found support near the $190 level against the US Dollar. The ETH/USD pair started an upside correction and recently traded above the $200 resistance. Moreover, bitcoin price recovered sharply above $10,000, sparking bullish moves in the crypto market. ETH price gained traction and broke the $210 and $220 resistance levels.
Moreover, there was a close above the $220 level and the 100 hourly simple moving average. The price even broke the 23.6% Fib retracement level of the last major decline from the $229 high to $190 low. Additionally, there was a break above a connecting bearish trend line with resistance at $214 on the hourly chart of ETH/USD. However, the pair ran into this week’s followed key bearish trend linen at $230.
The pair is currently consolidating below the $230 resistance and near the 100 hourly SMA. An initial support is near the $220 level, below which the price may perhaps dip towards the $212 support level. If there are more losses, the price might move back in a bearish zone towards $200 and $195.
On the other hand, if the price gains momentum above the $230 resistance, it could continue to rise. The next key resistance is near the $235 level (the previous swing high) plus the 50% Fib retracement level of the last major decline from the $229 high to $190 low. If there are more gains, the price may even test the $245 level, representing the 61.8% Fib retracement level of the last major decline from the $229 high to $190 low.
Looking at the chart, Ethereum price is showing a few positive signs above the $212 support level. However, the bulls need to gain strength above $230 and $235 to push the price back into a positive zone.
ETH Technical Indicators
Hourly MACD – The MACD for ETH/USD is struggling to gain momentum in the bullish zone.
Hourly RSI – The RSI for ETH/USD is currently well above the 50 level, with a bullish angle.
Major Support Level – $212
Major Resistance Level – $230
The post Ethereum Price (ETH) Breaks $220 While Bitcoin Rallied 10% appeared first on NewsBTC.
OhNoCrypto
via https://www.ohnocrypto.com
Aayush Jindal, Khareem Sudlow

