Ripple Price (XRP) Could Recover While BTC and ETH Facing Hurdles
#crypto #bitcoin
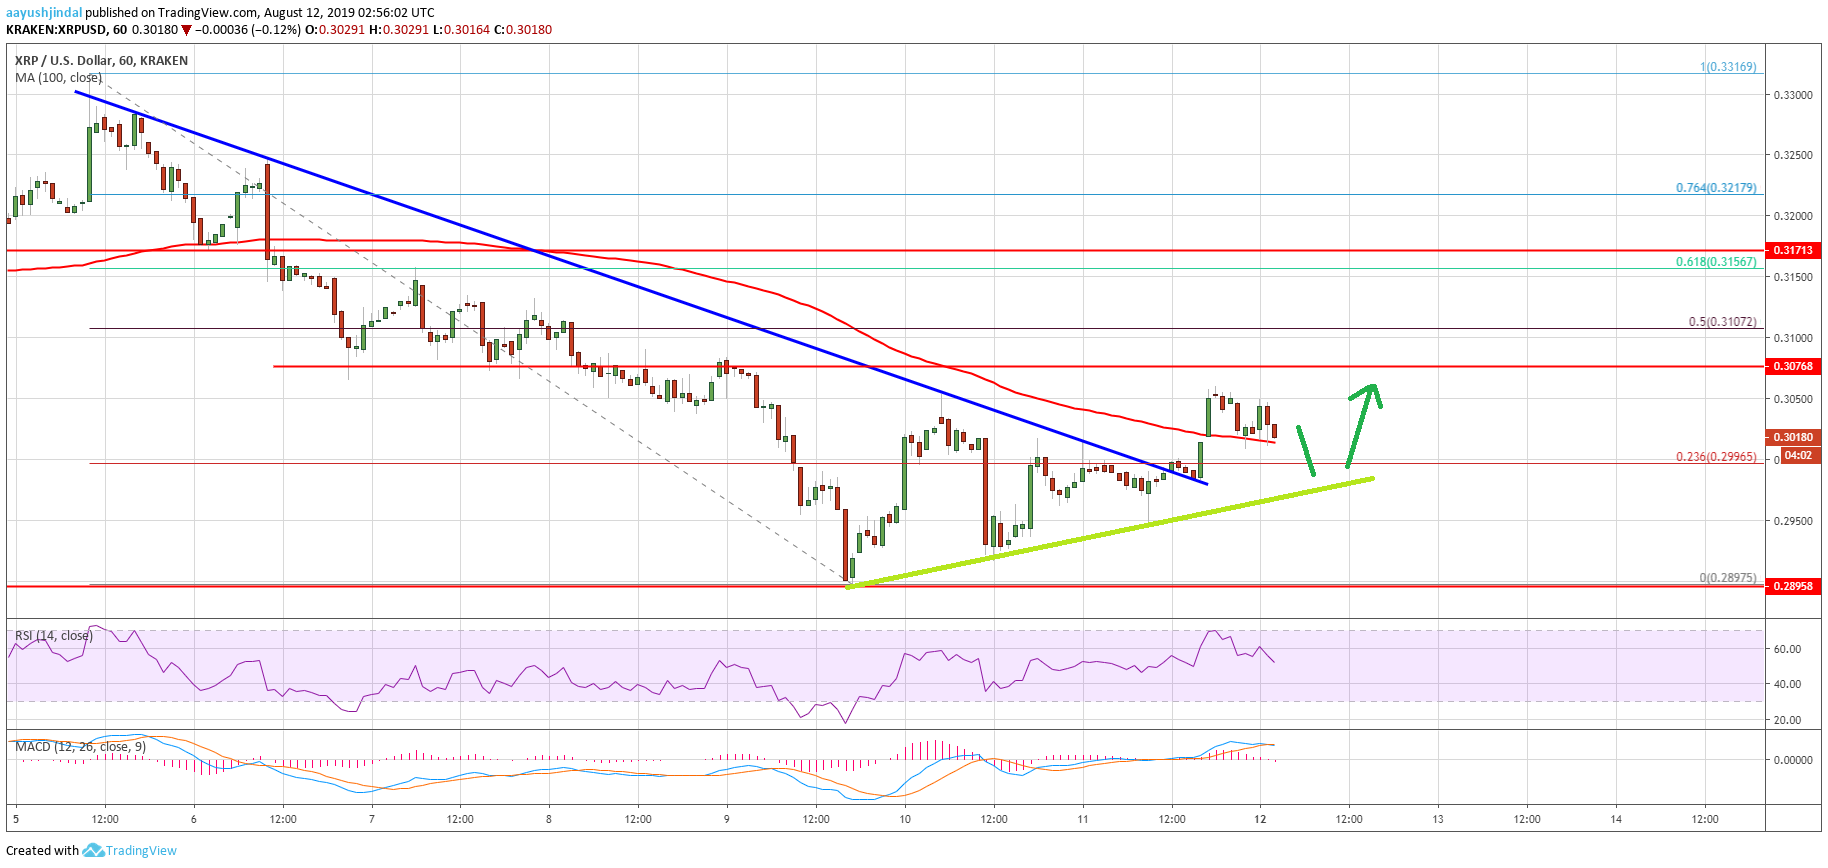
Ripple price formed a decent support above the $0.2900 level and recently corrected above $0.3000. There was a break above the 23.6% Fib retracement level of the last major drop from the $0.3316 high to $0.2897 low. Moreover, there was a break above a crucial bearish trend line with resistance near $0.2990 on the hourly chart of the XRP/USD pair.
The pair tested the $0.3050 resistance and it is currently consolidating above the 100 hourly SMA. On the upside, there are a few key resistances near $0.3075 and $0.3100. Moreover, the 50% Fib retracement level of the last major drop from the $0.3316 high to $0.2897 low is also near the $0.3100 area. Therefore, the price could accelerate gains if there is a break above $0.3075 and $0.3100.
On the downside, there is a decent support forming near $0.2950. Additionally, there is a connecting bullish trend line forming with support near $0.2950. Therefore, dips remains supported near $0.2950. If the price fails to stay above the $0.2950 support, there could be another slide towards the $0.2900 support. The next key support area is near the $0.2840 level.

Looking at the chart, ripple price is showing a few positive signs above the $0.2950 support area. However, the bulls need to gain traction above the $0.3050 and $0.3075 levels to push the price further higher. If they continue to struggle, there is a risk of a fresh decline towards $0.2900 or even $0.2840.
Hourly RSI (Relative Strength Index) – The RSI for XRP/USD is currently above the 50 level.
Major Support Levels – $0.3000, $0.2950 and $0.2900.
Major Resistance Levels – $0.3050, $0.3075 and $0.3100.
The post Ripple Price (XRP) Could Recover While BTC and ETH Facing Hurdles appeared first on NewsBTC.
OhNoCrypto
via https://www.ohnocrypto.com
Aayush Jindal, Khareem Sudlow
- Ripple price started an upside correction after trading to a new monthly low at $0.2897 against the US dollar.
- The price is trading above the $0.3000 level, with a few positive signs.
- There was a break above a crucial bearish trend line with resistance near $0.2990 on the hourly chart of the XRP/USD pair (data source from Kraken).
- The pair is likely to continue higher once it breaks the $0.3060-$0.3075 resistance area.
Ripple Price Analysis
Recently, there was a steady decline in ripple price below the $0.3050 and $0.3000 supports against the US Dollar. The XRP/USD pair even broke the $0.2950 support and the 100 hourly simple moving average. Finally, it tested the $0.2900 and traded to a new monthly low at $0.2897. Similarly, Ethereum price declined towards the $200 support area before starting an upside correction.Ripple price formed a decent support above the $0.2900 level and recently corrected above $0.3000. There was a break above the 23.6% Fib retracement level of the last major drop from the $0.3316 high to $0.2897 low. Moreover, there was a break above a crucial bearish trend line with resistance near $0.2990 on the hourly chart of the XRP/USD pair.
The pair tested the $0.3050 resistance and it is currently consolidating above the 100 hourly SMA. On the upside, there are a few key resistances near $0.3075 and $0.3100. Moreover, the 50% Fib retracement level of the last major drop from the $0.3316 high to $0.2897 low is also near the $0.3100 area. Therefore, the price could accelerate gains if there is a break above $0.3075 and $0.3100.
On the downside, there is a decent support forming near $0.2950. Additionally, there is a connecting bullish trend line forming with support near $0.2950. Therefore, dips remains supported near $0.2950. If the price fails to stay above the $0.2950 support, there could be another slide towards the $0.2900 support. The next key support area is near the $0.2840 level.

Looking at the chart, ripple price is showing a few positive signs above the $0.2950 support area. However, the bulls need to gain traction above the $0.3050 and $0.3075 levels to push the price further higher. If they continue to struggle, there is a risk of a fresh decline towards $0.2900 or even $0.2840.
Technical Indicators
Hourly MACD – The MACD for XRP/USD is slowly moving into the bearish zone.Hourly RSI (Relative Strength Index) – The RSI for XRP/USD is currently above the 50 level.
Major Support Levels – $0.3000, $0.2950 and $0.2900.
Major Resistance Levels – $0.3050, $0.3075 and $0.3100.
The post Ripple Price (XRP) Could Recover While BTC and ETH Facing Hurdles appeared first on NewsBTC.
OhNoCrypto
via https://www.ohnocrypto.com
Aayush Jindal, Khareem Sudlow
