Weekly Wrap: Bitcoin, Ethereum, BNB & Litecoin Price Analysis 9th August
Bitcoin price climbed higher steadily to a new monthly high near $12,320. BTC/USD is currently consolidating gains and it is likely to continue higher above $12,200 and $12,420.
On the other hand, most major altcoins, including Ethereum (ETH), ripple (XRP), bitcoin cash (BCH), litecoin (LTC), stellar (XLM), ADA, EOS, and TRX struggled to register gains. However, binance coin (BNB) was able to gain bullish momentum recently above the $30.00 resistance area.

Read: Bitcoin Trading Bots Guide
Key Takeaways:
- Bitcoin price is trading in a strong uptrend above the $11,700 and $11,425 support levels.
- Ethereum price is facing a lot of hurdles near the $235.00 resistance area.
- Ripple price remained in a bearish zone and failed to hold gains above $0.3200.
- EOS price settled below the key $4.600 and $4.500 support levels.
- Litecoin price failed to stay above the $100.00 level, but it is holding the key $87.00 support.
- Binance coin price rallied recently above the $29.60 and $30.00 resistance levels.
- MinexCoin (MNX) and DXG rallied more than 150% in the past 7 days.
Bitcoin Price Analysis
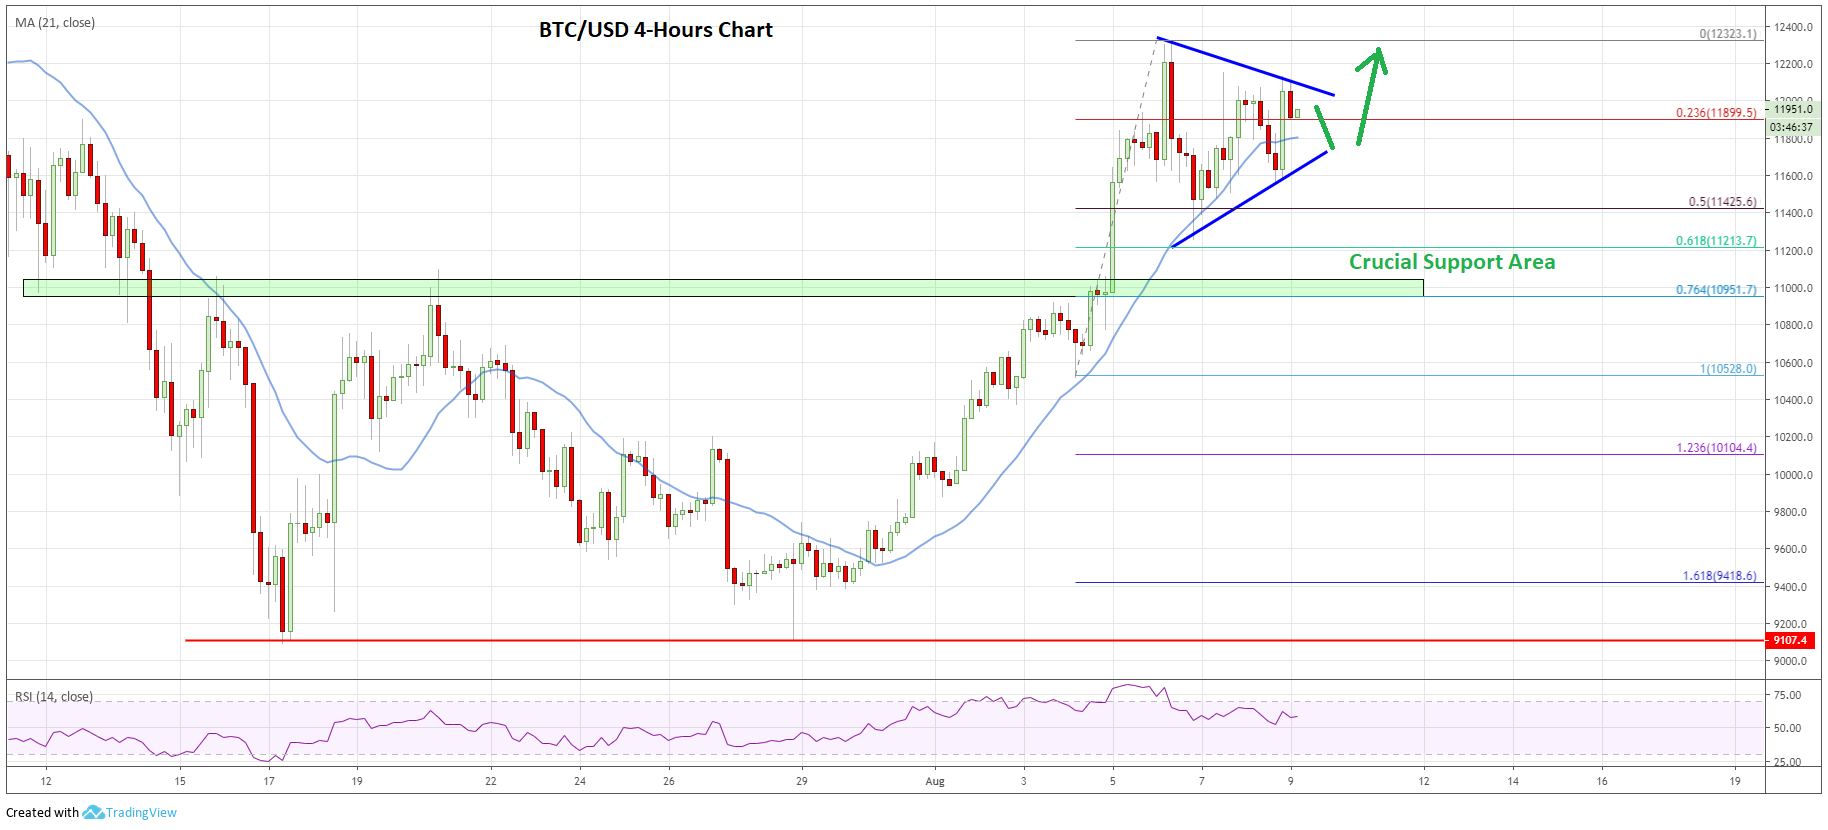
Bitcoin price started a strong rise after it broke the key $10,800 and $11,000 resistance levels. BTC/USD climbed steadily above the $11,500 and $11,750 resistance levels to move into a positive zone.
Bitcoin Price Chart: Click to Enlarge
Looking at the 4-hours chart, the price settled above the $11,550 pivot level and the 21 simple moving average (4-hours). Finally, the price surpassed the $12,000 resistance and traded to a new monthly high at $12,323.
Later, the price started a downside correction below the $12,000 level. Moreover, there was a break below the 23.6% Fib retracement level of the upward move from the $10,528 low to $12,323 high.
However, the decline was protected by the $11,250 level and the 21 simple moving average (4-hours). More importantly, the 50% Fib retracement level of the upward move from the $10,528 low to $12,323 high acted as a support.
The price climbed higher once gain above the $11,500 and $11,750 levels. However, the $12,000 and $12,150 levels are currently acting as key resistances.
Additionally, there is a crucial breakout pattern forming with resistance near the $12,180 level. If there is a successful break above the $12,180 and $12,250 resistance levels, the price is likely to surpass the $12,323 swing high.
The next major resistance is near the $12,500 level, above which bitcoin price could aim the $13,000 and $13,200 resistance levels.
Conversely, if the price fails to continue to higher, it could decline below the $11,750 and $11,650 levels. The next support is near the $11,225 level plus the 61.8% Fib retracement level of the upward move from the $10,528 low to $12,323 high. However, the main uptrend support is near $11,000, where the bulls are likely to take a stand.
Ethereum Price Analysis
Ethereum price managed to stay above the key $200.00 support level. ETH/USD recovered a few points and traded above the $220.00 and $225.00 resistance levels, but the bulls failed to gain traction.
Ethereum Price Chart: Click to Enlarge
Looking at the 4-hours chart, the price traded above the $230.0 resistance plus 21 simple moving average (4-hours). Moreover, there was a break above a major bearish trend line with resistance near $222 on the same chart.
However, the price struggled to surpass the key $235.00 and $240.00 resistance levels. A swing high was formed near $239.70 and the price is currently correcting lower.
It traded below the $230.00 level plus the 23.6% Fib retracement level of the upward move from the $198.23 low to $239.70 high. Moreover, the price seems to be following a declining channel with resistance near the $222.00 level.
Therefore, an upside break above $222.00 and $225.00 might push the price higher. Having said that, a successful close above the $235.00 and $240.00 resistance levels is needed for a sustained upward move in the near term.
On the downside, an initial support is near the $218.00 level plus the 50% Fib retracement level of the upward move from the $198.23 low to $239.70 high.
If there is a downside break below the $218.00 and $215.00 support levels, Ethereum price is likely to continue lower towards the main $200.00 support level.
Binance Coin Price Analysis (BNB/USDT, Binance Exchange)
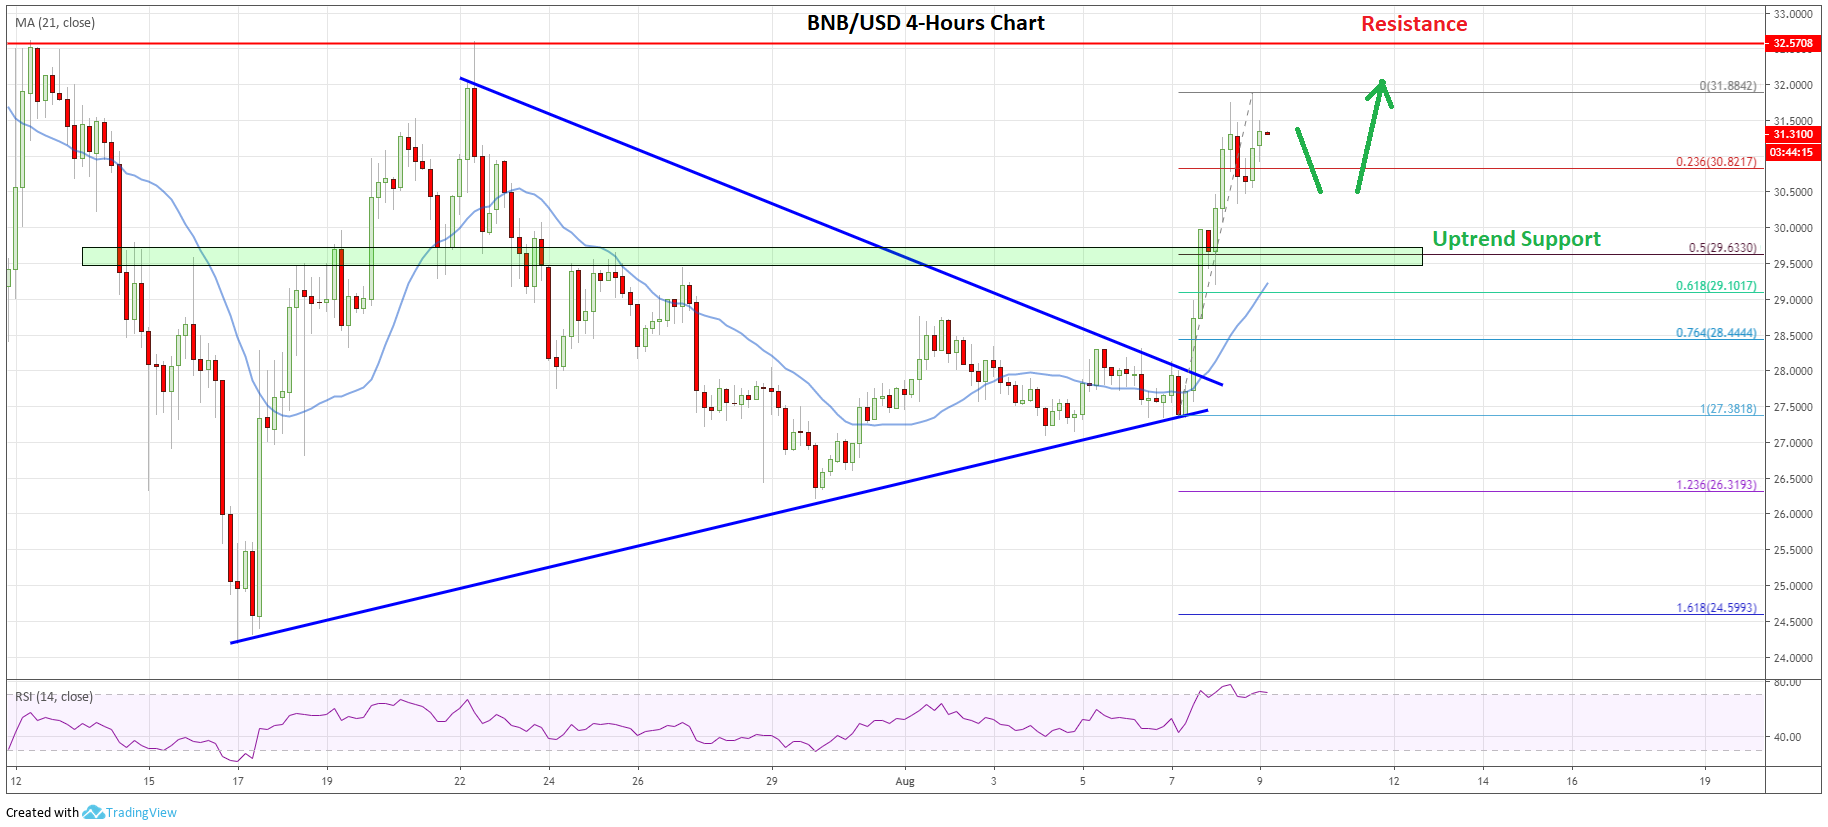
Binance coin performed really well in the past two day. BNB price formed a solid support near the $27.40 level and recently climbed above the $28.00 and $28.50 resistance levels.
Binance Coin Price Chart: Click to Enlarge
Looking at the 4-hours chart, the price gained strength after a successful close above $28.50 and the 21 simple moving average (4-hours). The price also broke a crucial bearish trend line with resistance near the $27.95 level.
It opened the doors for sharp gains and the price surged above the $29.60 and $30.00 resistance levels. The bulls even pushed the price above the $31.00 level and a swing high was formed at $31.88.
An immediate resistance is near the $32.00 level, above which the price could challenge the key $32.50 resistance area. Conversely, if there is a downside correction, the price may find bids near the $30.80 level.
The 23.6% Fib retracement level of the upward move from the $27.38 low to $31.88 high is also near the $30.80 level. However, the main supports on the downside are near the $30.00 and $29.60 levels.
The $29.60 support holds the key since it was a resistance earlier and now it could act as a buy zone. Besides, the 50% Fib retracement level of the upward move from the $27.38 low to $31.88 high is also near the $29.63 level.
Litecoin Price Analysis
Litecoin price spiked higher earlier this week above the $95.00 and $98.20 resistance levels against the US Dollar. The LTC/USD pair even broke the $100.00 resistance area, but the bulls failed to gain traction.
Litecoin Price Chart: Click to Enlarge
Looking at the 4-hours chart, the price failed near a crucial resistance area at $105.80. A swing high was formed at $107.03 and the price recently declined heavily.
It traded below the $100.00 support level and the 21 simple moving average (4-hours). Moreover, there was a close below the $95.00 support level. Finally, the price traded below the $90.00 level and tested a crucial support zone near the $86.00 and $87.00 levels.
The recent low was formed near $87.41 and the price is currently consolidating. An immediate resistance is near $90.00 and a bearish trend line. The next resistance is near $92.00, the 21 simple moving average (4-hours), and the 23.6% Fib retracement level of the decline from the $107.03 high to $87.41 low.
If the price surpasses the $90.00 and $92.00 resistances, it could recover towards the $100.00 resistance. An intermediate resistance is near $97.20 plus the 50% Fib retracement level of the decline from the $107.03 high to $87.41 low.
Conversely, if there is a downside break below the $87.00 support zone, litecoin price could tumble. The next important support is near the $80.00 and $78.20 levels.
Top Gainers
During the past 7 days, a few small cap altcoins climbed higher and gained more than 75%, including MNX, DXG, YOU, XRC, BOOM, TOPC and IPC (trading volume more than $50K). Out of these, MNX rallied around 160% and DXG is up nearly 155%.
To sum up, bitcoin price is trading in a nice uptrend above the $11,700 and $11,500 support levels. Having said that, BTC/USD must surpass the $12,000 and $12,200 resistance levels to continue higher. More importantly, it might be difficult for major altcoins such as Ethereum, ripple, bitcoin cash, litecoin, XLM, ADA, TRX, EOS, XMR, NEO, and BSV to stage a decent recovery in the near term.
The market data is provided by TradingView, Bitfinex.
The post Weekly Wrap: Bitcoin, Ethereum, BNB & Litecoin Price Analysis 9th August appeared first on Blockonomi.
OhNoCrypto
via https://www.ohnocrypto.com
Dr. Latika Mehrotra, Khareem Sudlow


