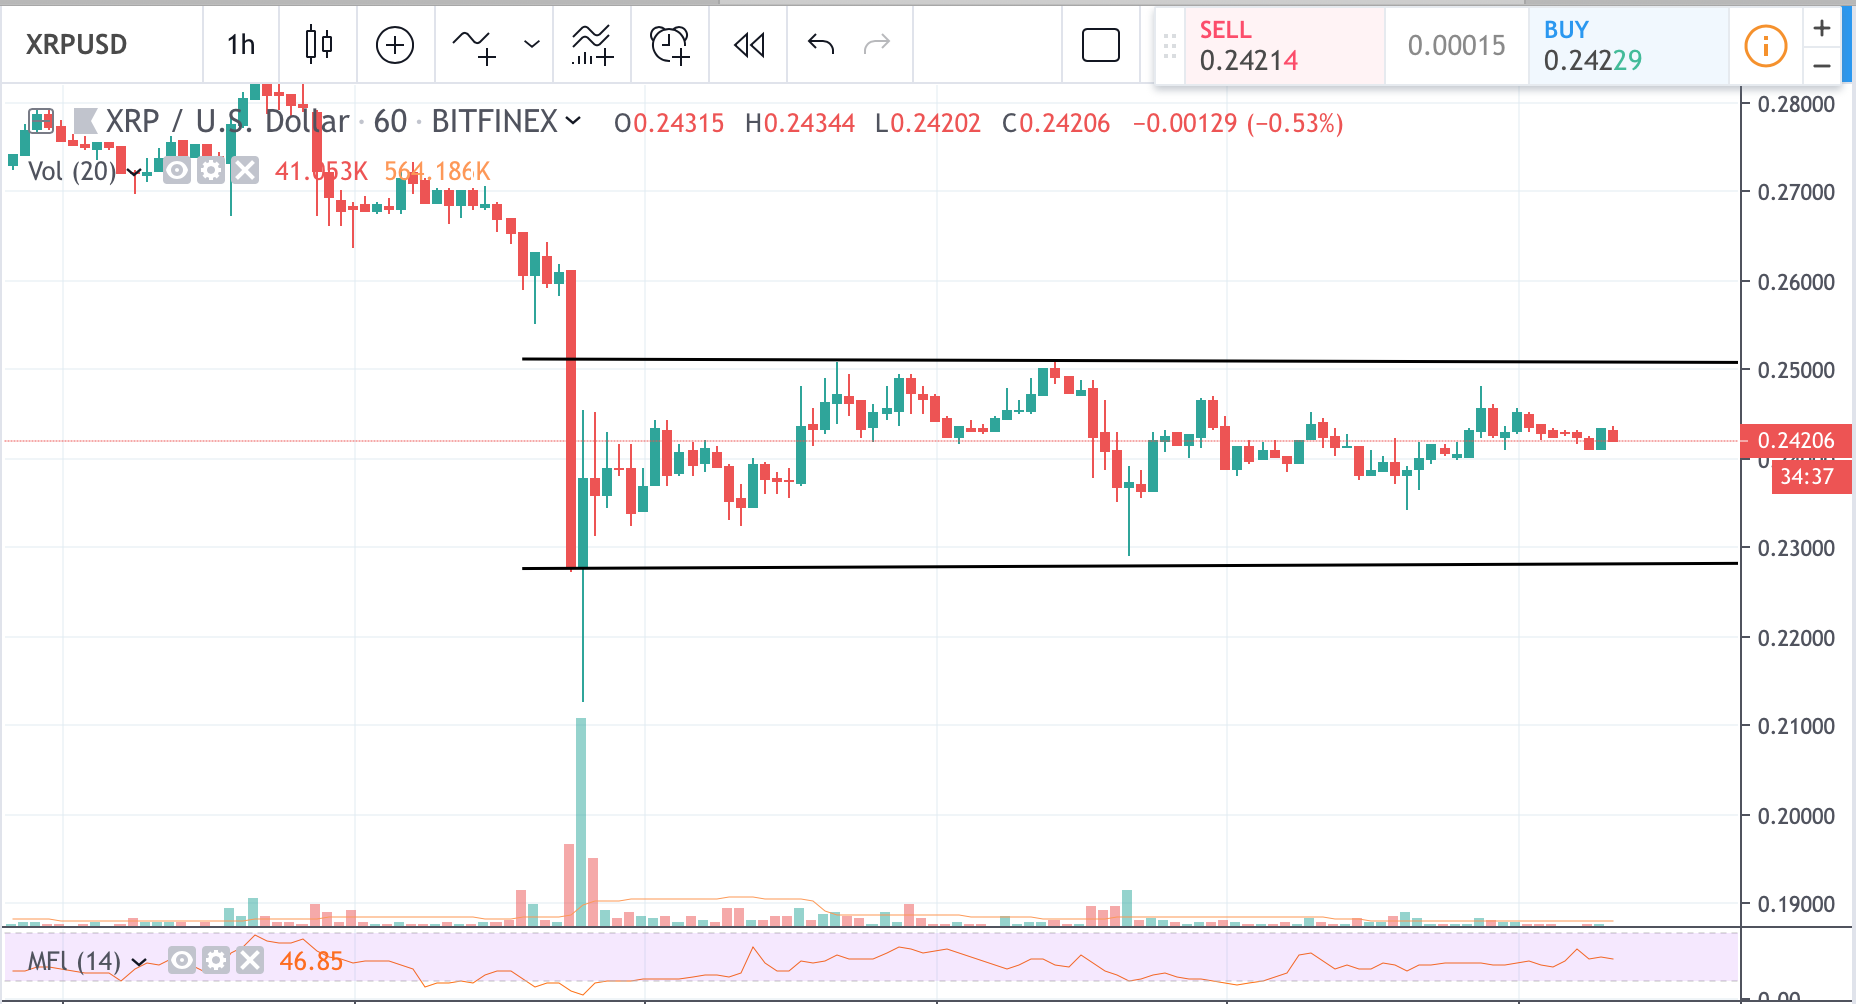
XRP price technical analysis. Horizontal trading channel
- XRP price trades sideways
- Stop-loss hunts continue
- Key support is $0.22800. Key resistance is $0.25100
1 Hour XRP/USD price chart

The horizontal trading channel has formed and XRP price continues to hit both stop losses for short and long positions. The price is yet to re-test the current level of resistance at $0.25100. If XRP price breaks that barrier on good volume and high momentum it is expected to test the next resistance level at $0.2600.
Alternatively, XRP price can test support levels $0.23400 and $0.2300 in a continuing search for stop losses at the bottom of the trading channel as well as at the resistance.
Several long term oscillators, including one-week MACD and RSI indicate falling bearish interest, so there is a possibility of a price upward movement in the near future.
Chart source: Tradingview
Disclaimer: Markets, instruments, and advice on this page are for informational purposes only and should not in any way come across as a recommendation to buy or sell in these assets. You should do your own thorough research before making any investment decisions. Ripplecoinnews does not in any way guarantee that this information is free from mistakes, errors, or material misstatements. Investing in Cryptocurrencies involves a great deal of risk, including the loss of all or a portion of your investment, as well as emotional distress. All risks, losses, and costs associated with investing, including total loss of principal, are your responsibility.
The post XRP price technical analysis. Horizontal trading channel appeared first on Latest Ripple (XRP) News & Price Analysis.
OhNoRipple via https://ift.tt/2PblI7a @RippleCoinNews, @Khareem Sudlow
