Bitcoin Price in a Period of Consolation May Slide Below the $8,000 Support Level
Oct 19, 2019 at 15:27 //
News
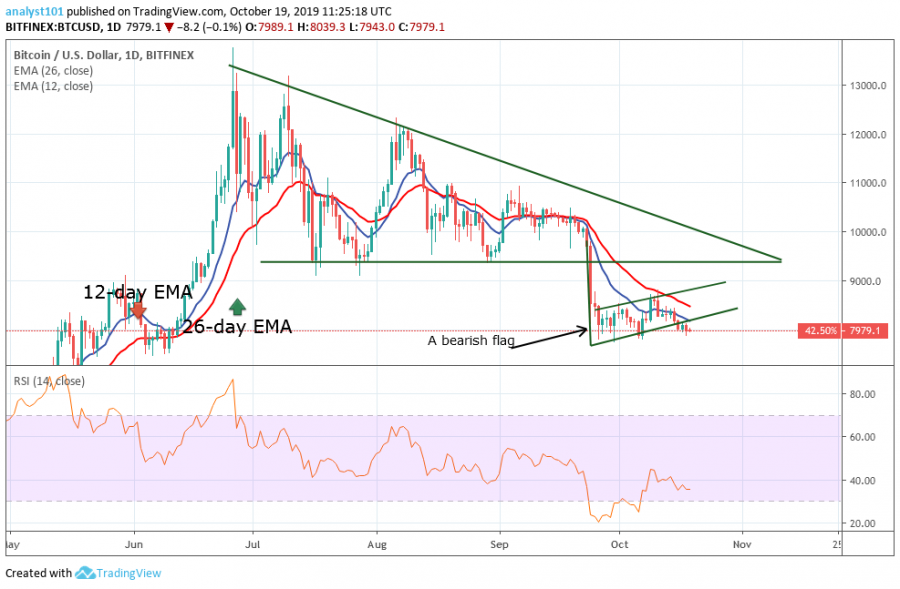
Bitcoin (BTC) fluctuates at the bottom attempting to form three tops in the price pattern. The formation of three tops and the eventual breakout below the $8,000 support level will confirm price pattern setup.
Bitcoin Price Long-Term Prediction: Bearish
Bitcoin price action pattern setup may eventually lead the cryptocurrency to further depreciation. In the last two weeks of October, the price action has formed an evenly distributed tops and bottoms after falling to the low above $8,000 support level. The price is characterized by Doji candlesticks which indicate equality and indecision in the market.
Today, October 19, the price is making a bullish move to form another top at the upper channel. In other words, Bitcoin may rise above the $8,800 price level but may eventually fall. This is because of the formation of the price pattern. The market is in a range bound zone according to the Relative Strength Index period 14 level 40.
Bitcoin Indicator Reading
On the daily chart, a bearish flag pole was formed on September 24 during a bearish impulse. Presently, Bitcoin is in a period of consolidation forming a bullish correction in the form of a flag. The price is likely to rise to form another top at the upper channel. When price tests the upper boundary of the channel, it is likely to be resisted.
However, if price breaks the lower channel line, Bitcoin is likely to fall. This is to confirm that a bearish flag pattern has been formed, and the price will fall in line with the prevailing trend. The exponential moving averages are trending southward which explains that the market is falling.
What Is the Next Direction for Bitcoin?
The Bitcoin price is consolidating at the bottom of the chart. The price action is forming a bearish flag from the bearish trend which is a continuation pattern. Now if the price rises to form another top but falls to break the lower channel, the downward move will continue along with the prevailing trend.
This bearish flag pattern will compel Bitcoin to fall and reach a low of $7,300 price level. Nevertheless, if the bulls break the upper channel and price is sustained above $9,000; then our bearish view will be invalidated.

Key Supply Zones: $10,000, $11,000, $12,000
Key Demand zones: $7, 000, $6, 000, $5,000
Disclaimer. This analysis and forecast are the personal opinions of the author, are not a recommendation to buy or sell cryptocurrency and should not be viewed as an endorsement by CoinIdol. Readers should do their own research before investing funds.
OhNoCryptocurrency via https://ift.tt/2PblI7a @, @Khareem Sudlow
