Ripple Struggles above $0.22 May Face Rejection at $0.23 or $0.24
#Bitcoin #OhNoCrypto

Ripple (XRP) is making an impressive move but may face resistance at $0.23.
Incidentally, this will confirm that XRP is fluctuating between the levels of $0.20 and $0.23. Interestingly, the coin’s ability to push above resistance zones will compel it to rally above $0.31. The pair will be out of the current low and may signal the resumption of an uptrend. In the interim, XRP is trading and approaching the first resistance at $0.23

Key Supply Zones: $0.35, $0.40, $0.45
Key Demand Zones: $0.25, $0.20, $0.15
Disclaimer. This analysis and forecast are the personal opinions of the author are not a recommendation to buy or sell cryptocurrency and should not be viewed as an endorsement by CoinIdol. Readers should do their own research before investing funds.
OhNoCryptocurrency via https://ift.tt/2PblI7a @coinidol.com By Coin Idol, @Khareem Sudlow
Dec 07, 2019 at 21:32 //
News
News

Ripple (XRP) is making an impressive move but may face resistance at $0.23.
Ripple (XRP) Price Long-Term Forecast: Ranging
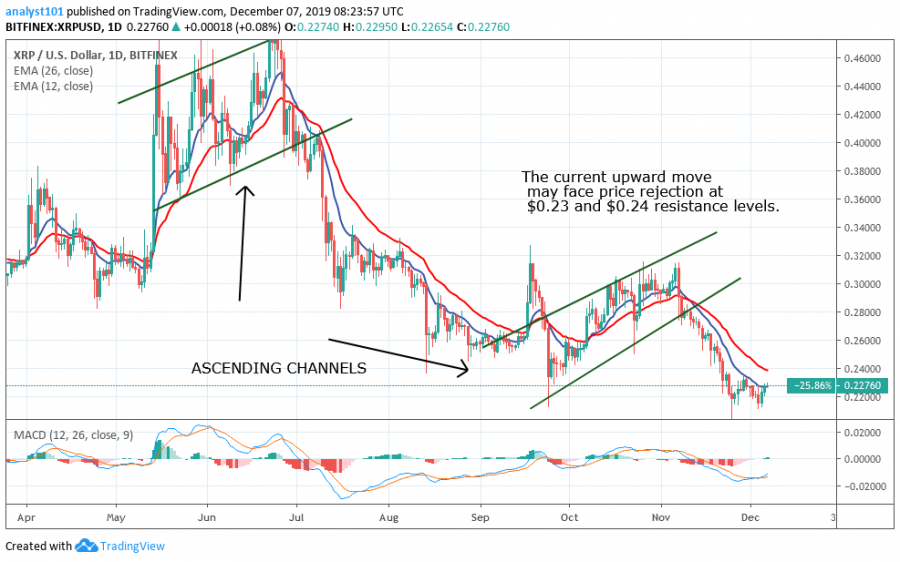
After a sharp decline on November 24, XRP traded and formed a price range. On its first decline, Ripple fell beneath $0.20 and moved up to $0.23. On its second drop, Ripple retested the previous low and it is pushing upward to the higher price levels. There is a likelihood that Ripple may face resistance at $0.23. However, any hindrance to price movement will compel XRP to continue its fluctuation.Incidentally, this will confirm that XRP is fluctuating between the levels of $0.20 and $0.23. Interestingly, the coin’s ability to push above resistance zones will compel it to rally above $0.31. The pair will be out of the current low and may signal the resumption of an uptrend. In the interim, XRP is trading and approaching the first resistance at $0.23
Ripple (XRP) Indicator Analysis
The MACD line and the signal line are beneath the zero line which signifies that the overall trend is a bear market. The EMAs are pointing southward while the blue line moving average acts as a hurdle to price movement.
What Is the Next Direction for Ripple (XRP)?
After the last bearish impulse, the market has confined itself to a price range. It has not traded above the first resistance. It has been trading within the range of $0.20 and $0.23. A move above the $0.23 and $0.24 is likely to make a positive effect on the coin and bring the coin out of the downtrend. Buyers need to come in to effect a change in this price zone or the price will continue its fluctuations.Key Supply Zones: $0.35, $0.40, $0.45
Key Demand Zones: $0.25, $0.20, $0.15
Disclaimer. This analysis and forecast are the personal opinions of the author are not a recommendation to buy or sell cryptocurrency and should not be viewed as an endorsement by CoinIdol. Readers should do their own research before investing funds.
OhNoCryptocurrency via https://ift.tt/2PblI7a @coinidol.com By Coin Idol, @Khareem Sudlow
