Tezos Price Analysis - Limited upside potential
#crypto #bitcoin
OhNoCrypto
via https://www.ohnocrypto.com
Josh Olszewicz, Khareem Sudlow
As most exchanges have both listed XTZ and announced staking support, further upside may be limited until additional fundamental events can fuel speculation to a new all-time high. Currently, just over 10% of the XTZ circulating supply is held by exchange bakeries.
Tezos (XTZ) is a decentralized smart contract and application network, with an on-chain governance layer designed to enable efficient network upgrades and provide a transparent stakeholder community. The asset is currently 10th on the BraveNewCoin market cap table, just below Bitcoin SV. The current XTZ/USD spot price is down 14% from the record high established in May 2019, with a current market cap of US$1.06 billion, and a total of US$64 million in trade volume over the past 24 hours.
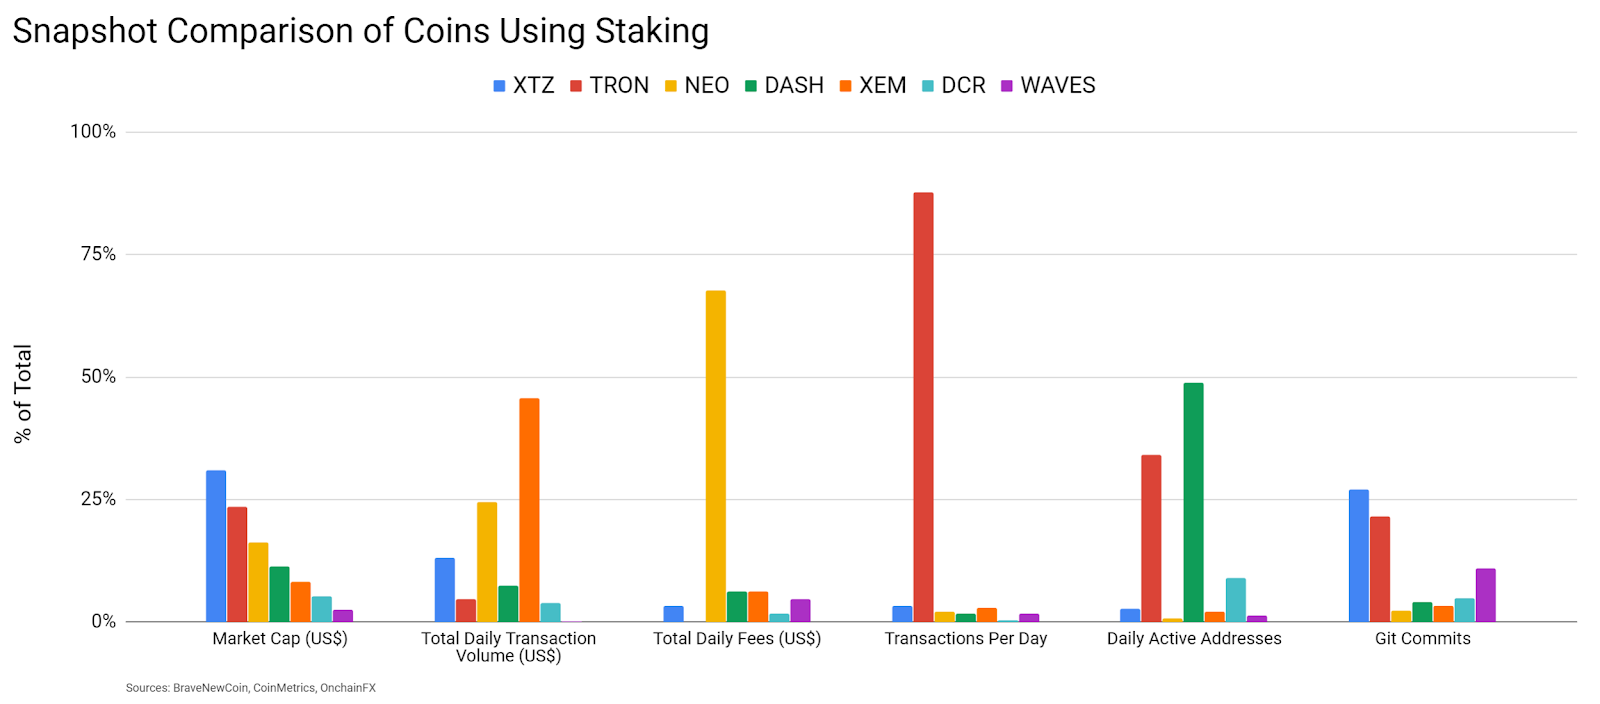
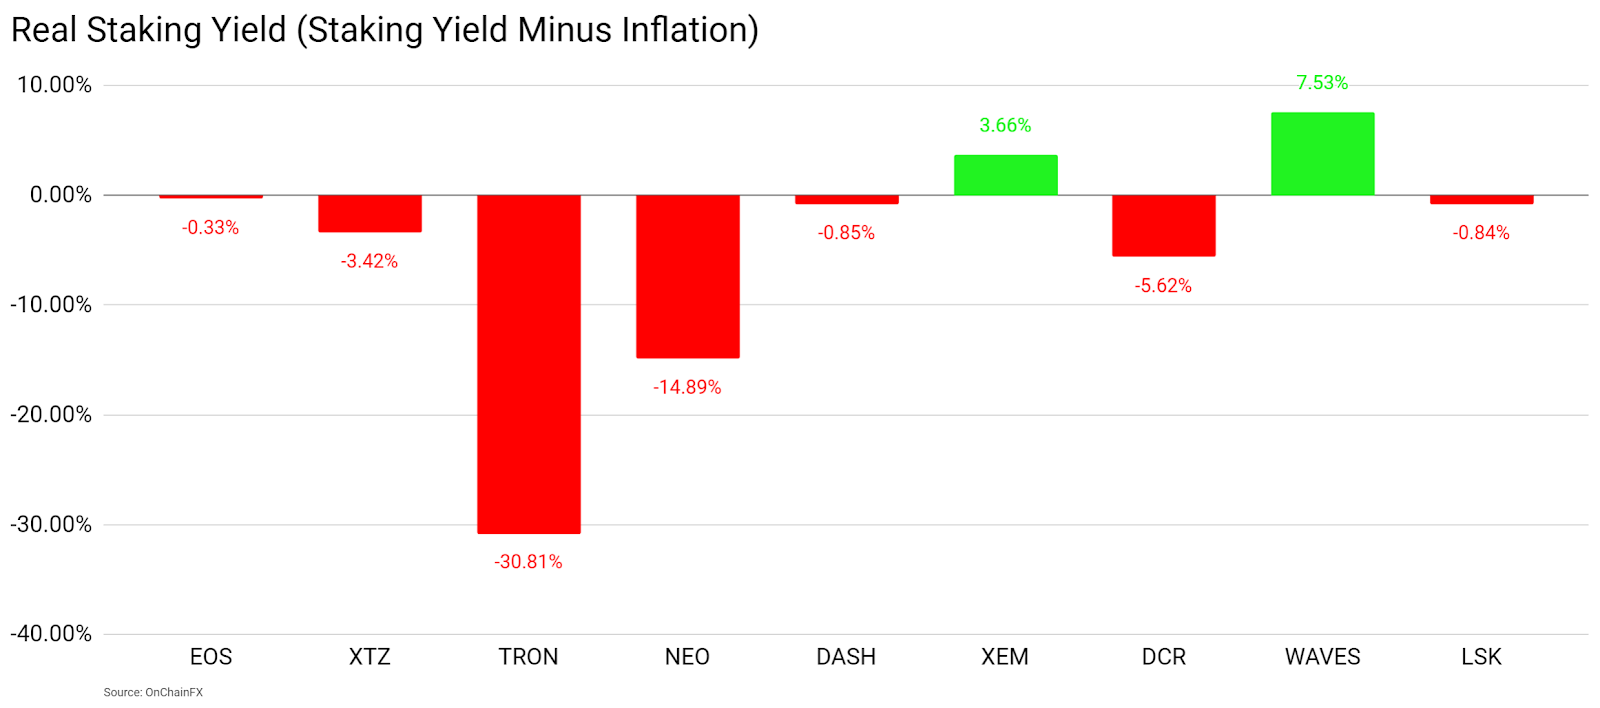
A quick comparison between coins using a staking mechanism shows XTZ near the middle of the pack. XTZ leads in Git commits over the past year and has the second highest transactions per day, after Tron (TRX). The XTZ real staking yield, or staking yield minus inflation, is also in the middle of the pack when compared to the same group coins. However, the real staking yield varies. EOS (EOS) was excluded from the on-chain data comparison due to a lack of currently available reliable on-chain data.
Portions of the XTZ model were first envisioned by Gordon Mohr and L.M. Goodman in late 2013 and early 2014. Kathleen Breitman and Arthur Breitman released the first Tezos position paper and white paper in late 2014.
The initial development occurred in the setting of both Bitcoin and Ethereum scaling and governance disputes. Funding in 2016 was provided by Polychain Capital and notable advisors include Emin Gün Sirer and Zooko Wilcox of Zcash.
The Switzerland-based Tezos Foundation was created in April 2017 with a goal of providing support to XTZ and related technologies as well as to the XTZ community. The project’s initial coin offering (ICO) occurred from July 1st to July 13th 2017 at a price of US$0.47 per token. The ICO raised a total of 65,000 BTC and 325,000 ETH, or US$232 million, one of the largest ICOs at that time.
As of August 2019, the Tezos Foundation holds a reported US$652 million in mixed assets; 61% in BTC, 15% in XTZ, 15% in bonds, ETFs, and commodities at Swiss banks, 6% in fiat, and 3% in other assets
Following the ICO, a dispute between then Tezos Foundation president Johann Gevers and the Breitmans pushed initial development back multiple months. Additionally, in October 2017, a class-action lawsuit was registered against Tezos in the Superior Court of California, citing "violation of the registration and anti-fraud provisions of the federal securities laws, as well as state false advertising, and unfair competition laws."
In June 2018, Tezos announced they would be requiring user identification to satisfy Know Your Customer/Anti-Money Laundering (KYC/AML) laws, information that wasn’t initially collected during the ICO. The genesis block was also completed in June 2018, with 608 million XTZ created and no limit on the total XTZ supply. The mainnet went live in September 2018 with user ICO tokens unlocking in November 2018.
The Tezos ledger uses a delegated Proof of Stake consensus mechanism with a target block time of one minute and current annual inflation of 5.5%. Nearly 76% of the current circulating supply is participating in staking, or ‘baking’ on the XTZ chain, which is among the highest total USD value of all PoS chains.
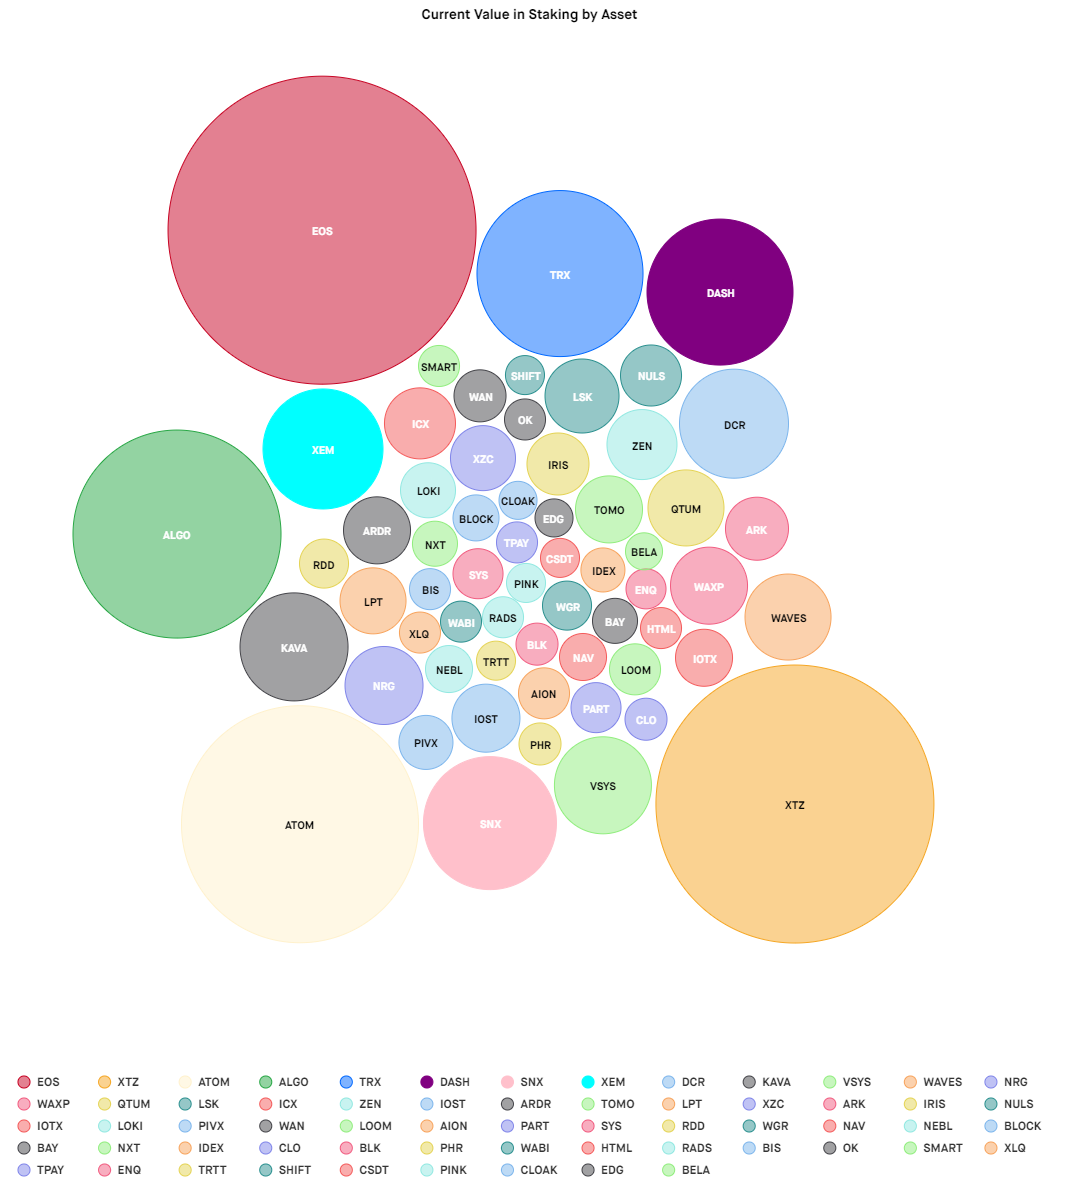
Source: StakingRewards
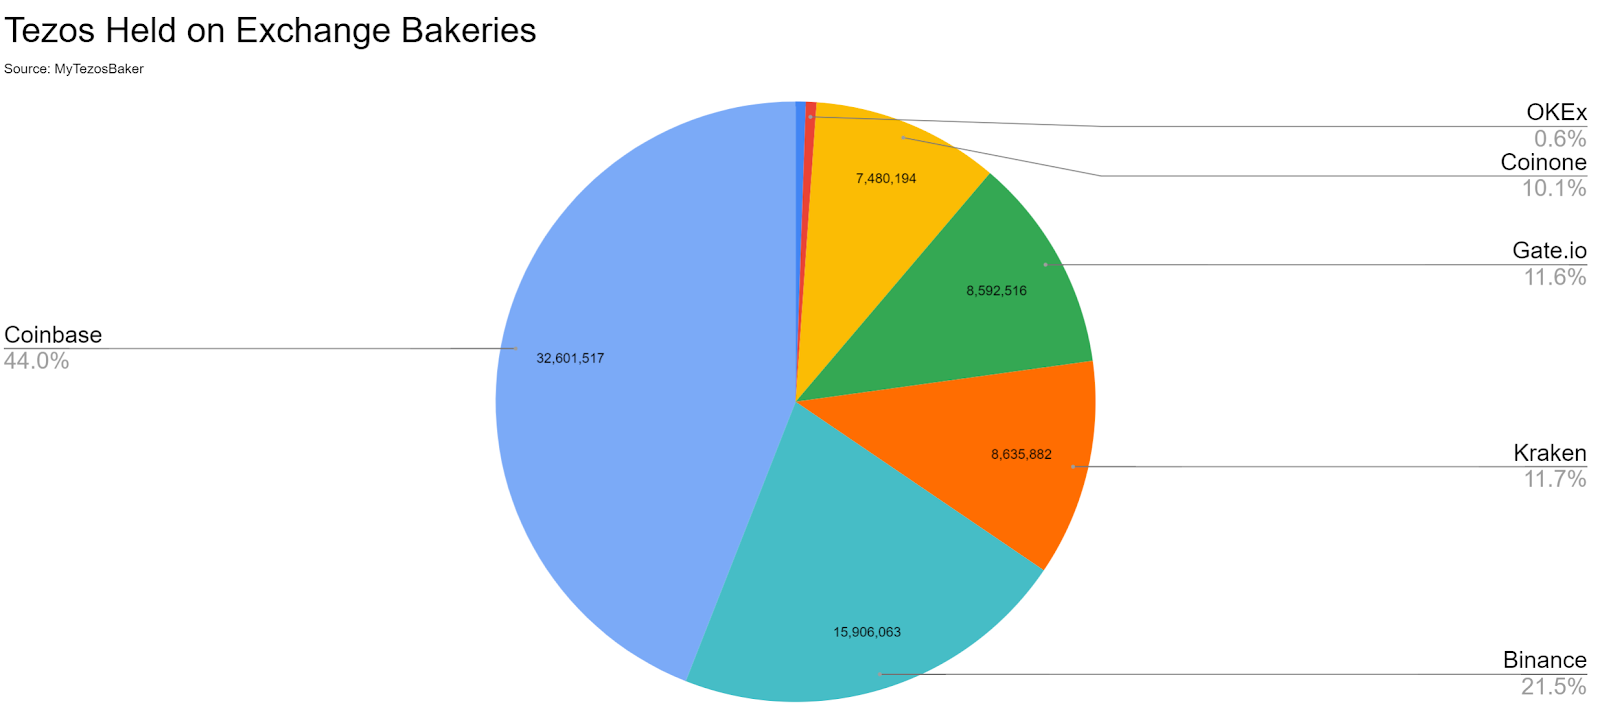
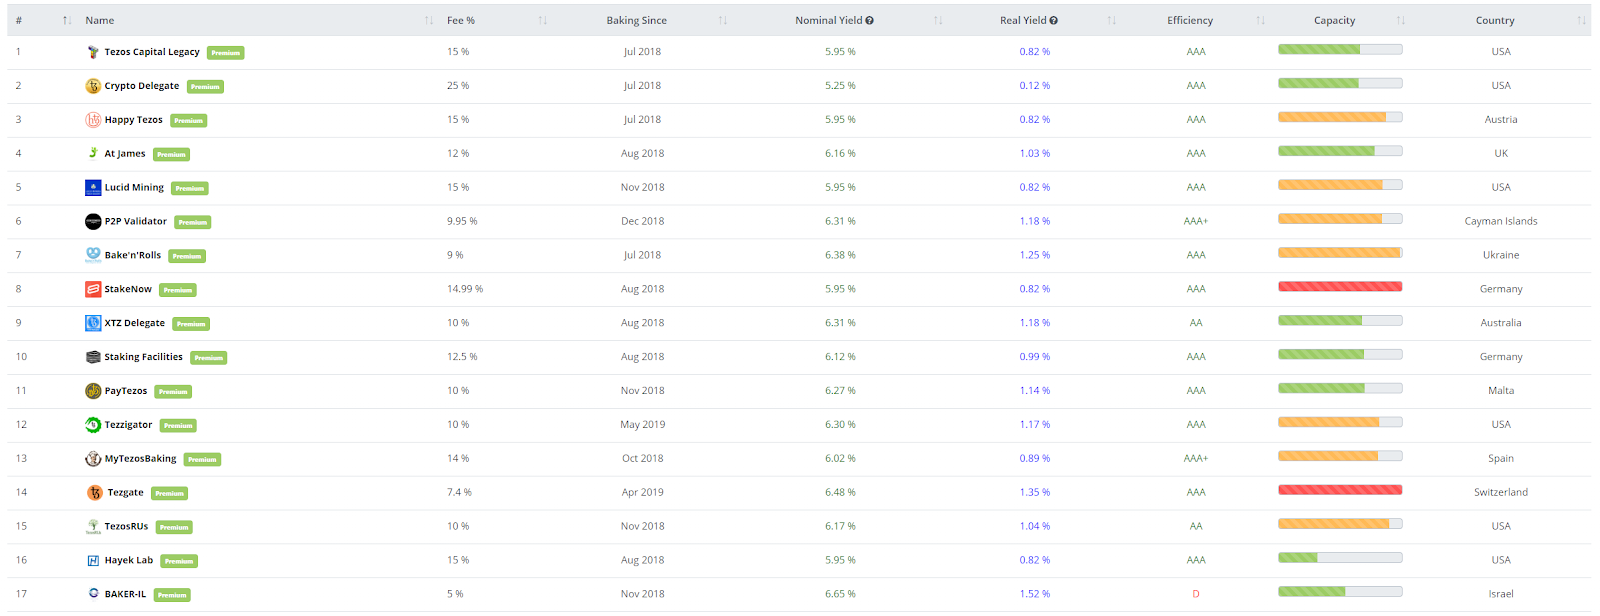
There are seven exchange bakeries, with Coinbase holding the lion’s share. In total, just over 10% of the Tezos circulating supply is held on exchange bakeries. Initially, bakers needed at least 10,000 XTZ, or US$15,810 at current prices, to become a delegate. Users with less than 10,000 XTZ could also participate in staking through delegation services.
Bakers participate and manage XTZ nodes and protocol amendments, as well as software updates and patches. Bakers also charge delegators for their services as network amenders and block producers. At the beginning of each cycle (4,096 blocks or about three days), the Bakers for each block are randomly selected and published. Bakers earn a block reward of 16 XTZ for baking a block. In addition to the Baker, 32 Endorsers are randomly selected to verify the last block that was baked. Endorsers receive 2 XTZ for each block they endorse.
Source: MyTezosBaker
Protocol amendments are adopted over election cycles every 131,072 blocks, or about every three months. Amendments are only voted on by the community, and not the Tezos Foundation. In late May, the XTZ community voted to activate Athens, the first XTZ on-chain governance proposal. Athens increased the gas limit to allow for larger transaction throughput and reduced the minimum amount of XTZ required to bake, from 10,000 XTZ to 8,000 XTZ.
In the last round of voting, the Brest amendment was rejected. The Babylon 2.0 amendment is currently being voted on and will likely be implemented in October. The Babylon upgrades include; changing the consensus algorithm to Emmy+, which would make it easier to write smart contracts in the scripting language Michelson, distinguishing accounts from smart contracts, and changing quorum floors and caps.

Source: Tezos Blog
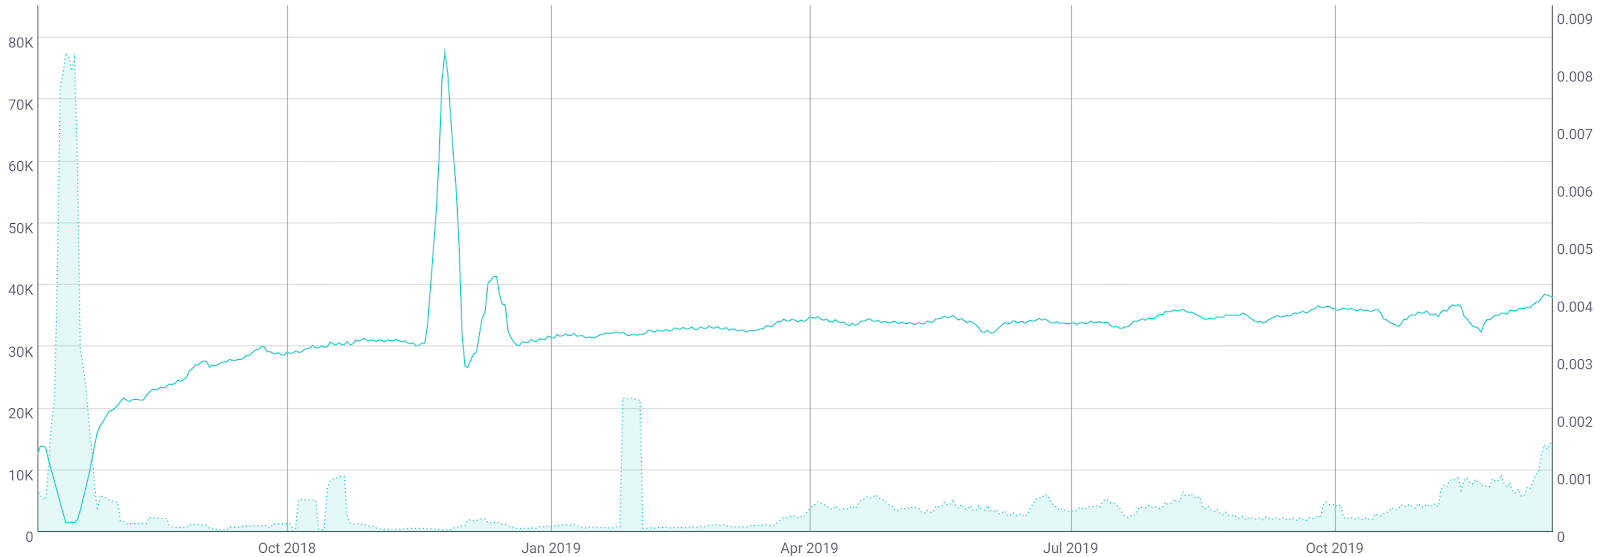
On the network, the current total number of transactions per day (line, chart below) has ranged from 30,000 to 38,000 since the beginning of the year. Average transaction fees (fill, chart below) ranged from US$0.0001 to US$0.0007 for most of the year, doubling increasing recently to US$0.0015. Average transaction values have also increased from just under US$300 to just above US$5,000 since November (not shown).
Source: CoinMetrics
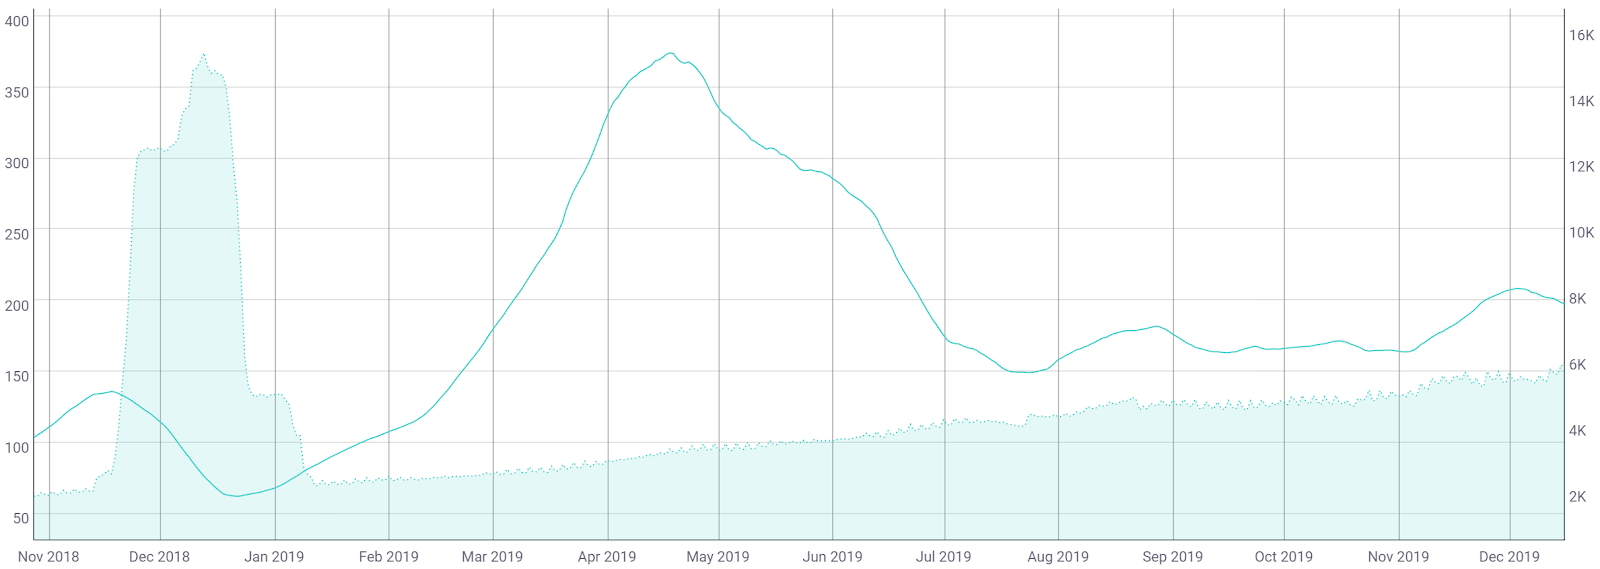
The 30-day Kalichkin network value to estimated on-chain daily transactions (NVT) ratio (line, chart below) is currently 197 and falling, while currently near the middle of the historic norm.
Inflection points in NVT can be leading indicators of a reversal in asset value. An uptrend in NVT often suggests a coin is overvalued based on its economic activity and utility, which should be seen as a bearish price indicator, whereas a downtrend in NVT suggests the opposite. NVT below 100 typically indicates organic and sustained bull market conditions.
Active and unique addresses also are important to consider, specifically when determining the fundamental value of the network based on Metcalfe's law. Monthly active addresses (MAAs) have continued to increase since January 2019 (fill, chart below). In November 2018, addresses spiked due to the release of the claimed tokens from the ICO. A consistent and sustained increase in MAAs paints a bullish picture for any asset.
Source: CoinMetrics
The XTZ project is programmed in OCaml with the main repo on GitLab recording nearly 3,800 commits over the past year (shown below). As of early this month, the Tezos Foundation reported 1,338 developers have completed or are working to complete the Tezos training course.
Most coins use the developer community of Github or GitLab where files are saved in folders called "repositories," or "repos," and changes to these files are recorded with "commits," which save a record of what changes were made, when, and by who. Although commits represent quantity and not necessarily quality, a higher number of commits can signify higher dev activity and interest.

Source: GitLab
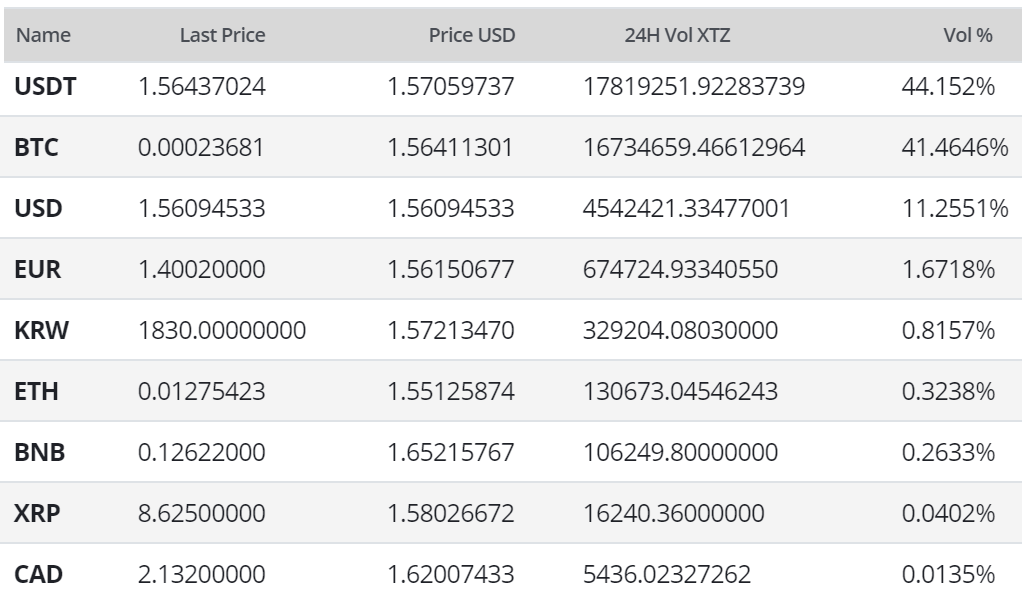
In the markets, XTZ exchange volume has been led by the BTC, USD, and USDT pairs on Kraken and Coinbase. The USDT pair currently holds a 0.6% premium over the USD pair. XTZ was listed on HitBTC in July 2017, Gate.io in July 2018, Bitfinex in September 2018, Kraken in October 2018, Huobi in December 2018, Coinbase and eToro in August 2019, Binance in September 2019, OKEx in November 2019, and Bittrex this week. Bitfinex also added XTZ/USD and XTZ/BTC margin pairs in August. XTZ is not currently listed on Gemini or Poloniex. Binance, Coinbase, Coinone, Gate.io, Kraken, Kucoin, OKEx, and the Trezor and Ledger hardware wallets provide staking support for XTZ.
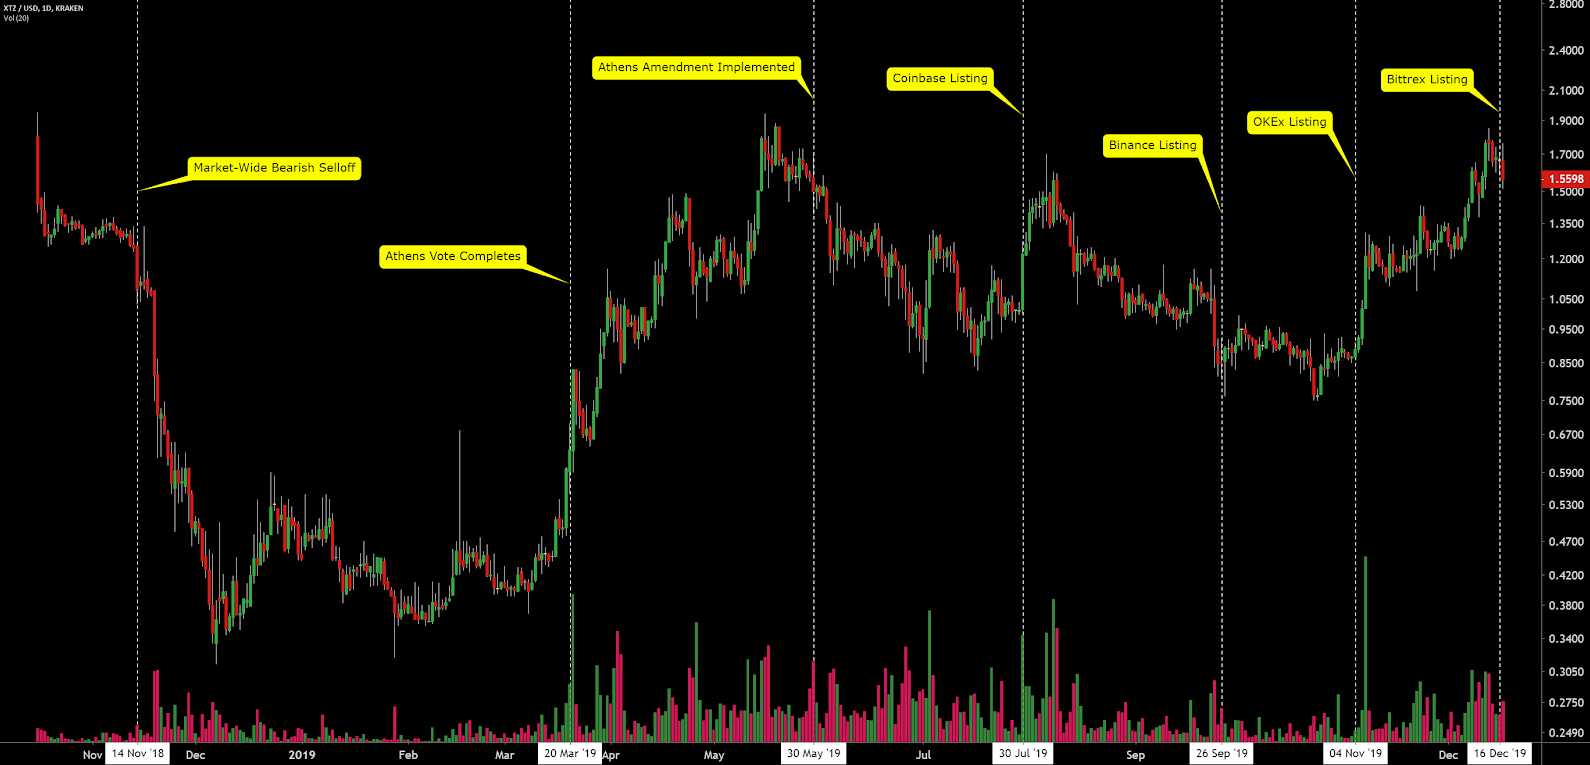
Worldwide Google Trends data for the term "tezos" increased slightly beginning in March this year, around the voting of the Athens amendment, which is also reflected in the price of the asset. The July 2017 spike in “tezos” searches corresponds with the project’s ICO. The most recent search spike corresponds with the several exchange listings over the past few months.
Google Trends data has been found to have some correlation with crypto prices. A 2015 study found a strong correlation between the Google Trends data and BTC price, while a 2017 study concluded that when the U.S. Google "bitcoin" searches increased dramatically, BTC price dropped.

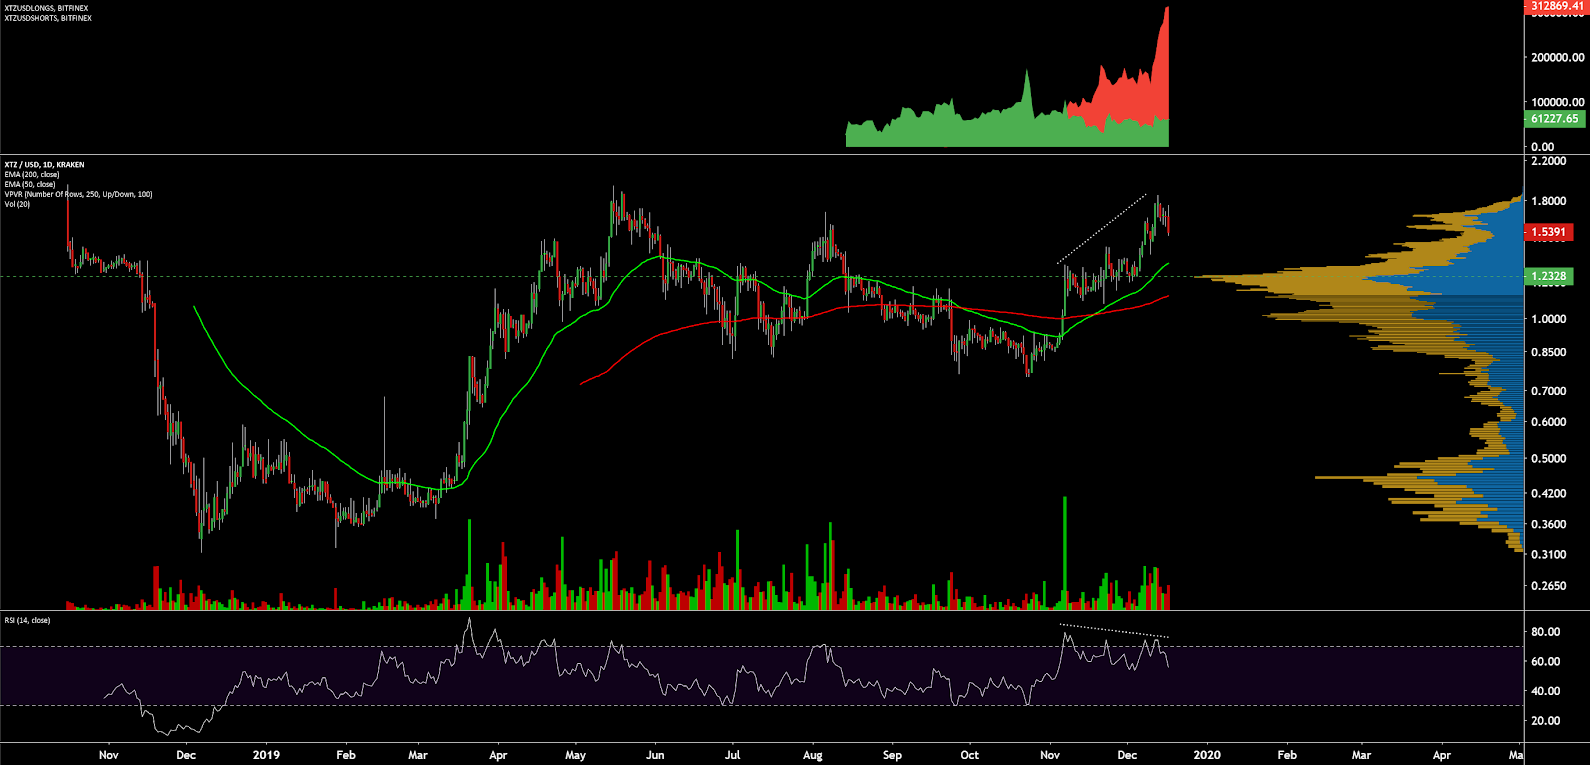
On the daily chart for the XTZ/USD pair, the 50-day Exponential Moving Average (EMA) and 200-day EMA crossed bullish on November 18th, which was followed by a 50% bullish rally. Thus far, the US$2.00 zone appears to be heavy psychological resistance. Historical volume support (horizontal bars) shows support at US$1.23.
Bitfinex open interest is 84% short (top panel, chart below), with short positions rising rapidly and reaching an all-time high earlier this week. A significant price movement upwards will result in an exaggerated move as the short positions will begin to unwind. There is a growing and active two-month bearish volume and RSI divergence suggestive of waning bullish momentum.
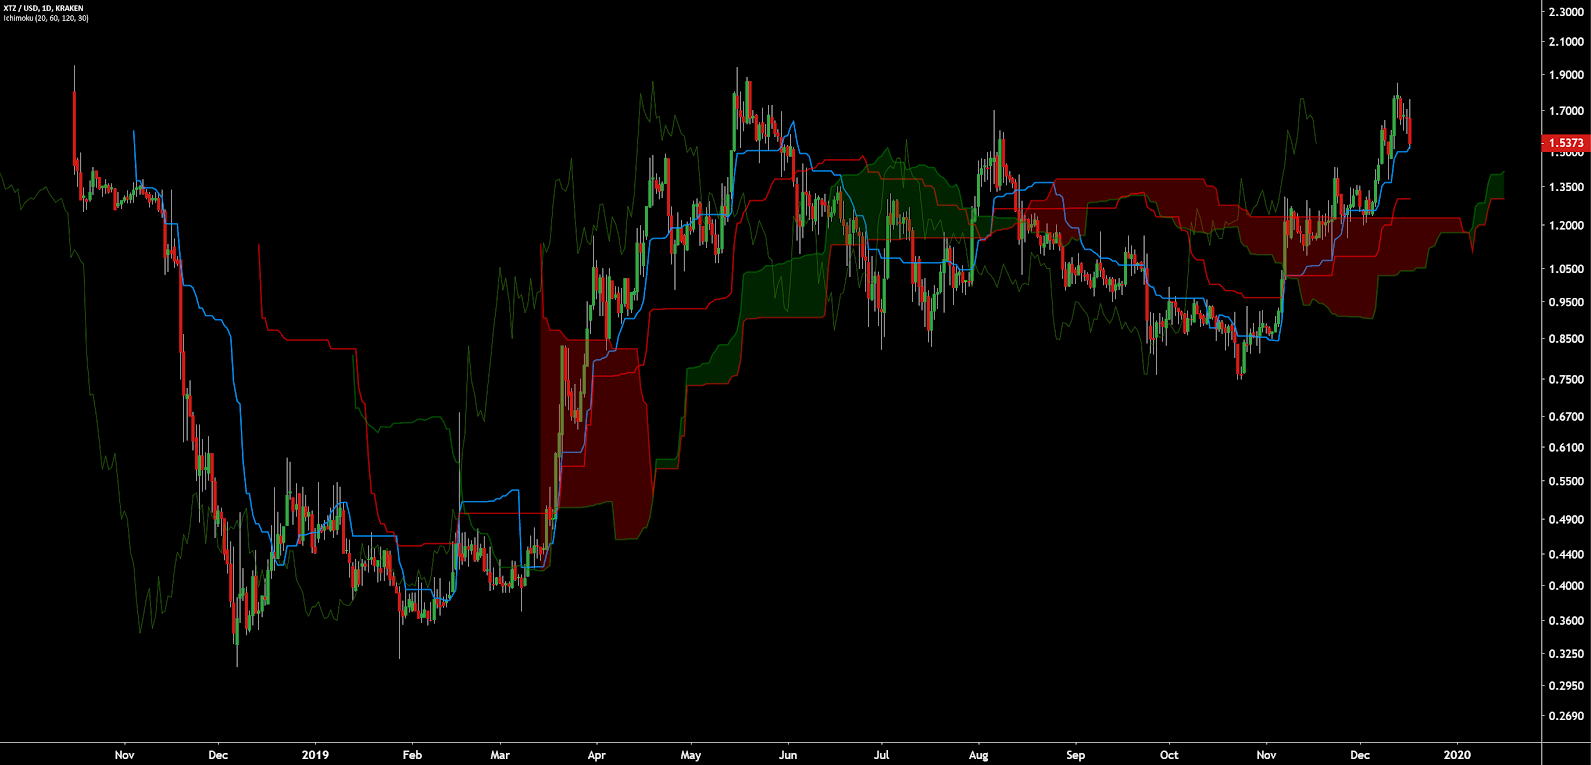
Turning to the Ichimoku Cloud, four metrics are used to indicate if a trend exists; the current price in relation to the Cloud, the color of the Cloud (red for bearish, green for bullish), the Tenkan (T) and Kijun (K) cross, and the Lagging Span. The best entry always occurs when most of the signals flip from bearish to bullish, or vice versa.
Cloud metrics on the daily time frame, with doubled settings (20/60/120/30) for more accurate signals, are currently bullish; price is above the Cloud, the Cloud is bullish, the TK cross is bullish, and the Lagging Span is above the Cloud and above price. The current TK disequilibrium (c-clamp) suggests mild overbought conditions. A traditional long re-entry signal will trigger once price returns to the Kijun at US$1.30.
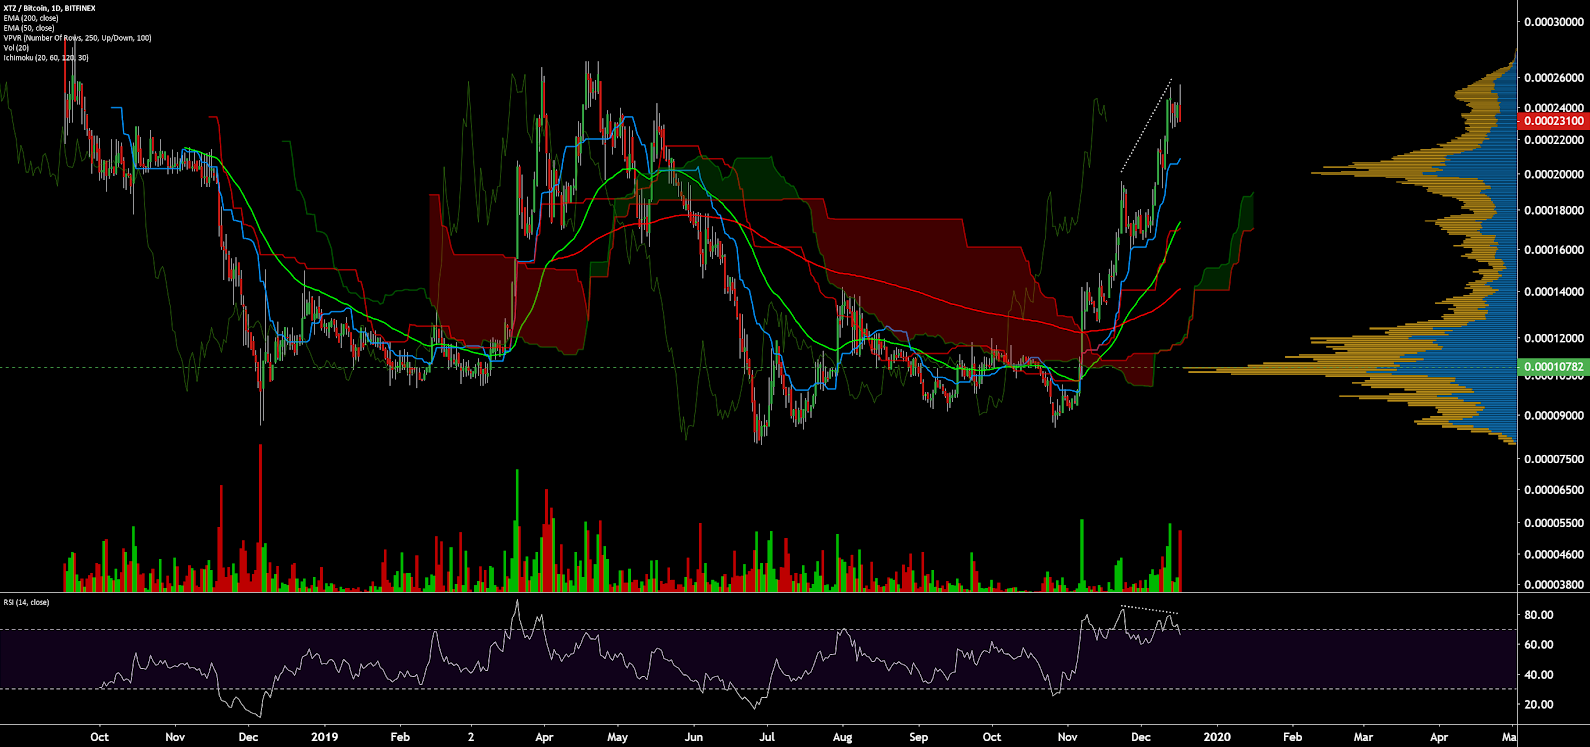
On the daily chart for the XTZ/BTC pair, price broke above both the 200-day EMA and daily Cloud on november 7th, leading to a 108% bull rally. Cloud metrics are also currently all bullish, however, the TK disequilibrium (c-clamp) suggests extreme overbought conditions. Historic volume support sits at the psychological zone of 20,000 sats. There is also a bearish RSI divergence suggestive of waning bullish momentum. Price will likely need to reconsolidate near the all-time high zone before further attempts at higher highs. Bitfinex open interest is 93% short (not shown).
The high percentage of staked circulating supply, at nearly 75%, may suggest there is not much else to do with XTZ currently, as smart contracts and dapps have yet to take hold. The high staking percentage is likely directly related to several exchanges and custody services allowing for staking participation. Currently, just over 10% of the XTZ circulating supply is held by exchange bakeries. As most exchanges have both listed XTZ and announced staking support, further upside may be limited until additional fundamental events can fuel speculation to a new all-time high.
Technicals for the XTZ/USD pair are bullish as trend metrics are strongly in favor of a definitive bullish trend. XTZ is one of the few coins spot prices prices above both the daily 200-EMA and daily Cloud. Upside resistance sits at the psychological resistance of US$2.00 before the asset enters price discovery mode. A 1.618 fib extension drawn from all-time high to all-time low yields a potential price target of US$3.95. Strong price support currently sits at US$1.30 based on the daily Kijun and volume profile.
Technicals for the XTZ/BTC suggest a strong but heavily overbought bullish rally. Again, this pair sits high above both the daily 200-EMA and daily Cloud. Strong upside resistance sits at the all-time high range of 25,000 sats - 30,000 sats whereas support sits at the psychological level of 20,000 sats.
Tezos (XTZ) is a decentralized smart contract and application network, with an on-chain governance layer designed to enable efficient network upgrades and provide a transparent stakeholder community. The asset is currently 10th on the BraveNewCoin market cap table, just below Bitcoin SV. The current XTZ/USD spot price is down 14% from the record high established in May 2019, with a current market cap of US$1.06 billion, and a total of US$64 million in trade volume over the past 24 hours.
A quick comparison between coins using a staking mechanism shows XTZ near the middle of the pack. XTZ leads in Git commits over the past year and has the second highest transactions per day, after Tron (TRX). The XTZ real staking yield, or staking yield minus inflation, is also in the middle of the pack when compared to the same group coins. However, the real staking yield varies. EOS (EOS) was excluded from the on-chain data comparison due to a lack of currently available reliable on-chain data.


Portions of the XTZ model were first envisioned by Gordon Mohr and L.M. Goodman in late 2013 and early 2014. Kathleen Breitman and Arthur Breitman released the first Tezos position paper and white paper in late 2014.
The initial development occurred in the setting of both Bitcoin and Ethereum scaling and governance disputes. Funding in 2016 was provided by Polychain Capital and notable advisors include Emin Gün Sirer and Zooko Wilcox of Zcash.
The Switzerland-based Tezos Foundation was created in April 2017 with a goal of providing support to XTZ and related technologies as well as to the XTZ community. The project’s initial coin offering (ICO) occurred from July 1st to July 13th 2017 at a price of US$0.47 per token. The ICO raised a total of 65,000 BTC and 325,000 ETH, or US$232 million, one of the largest ICOs at that time.
As of August 2019, the Tezos Foundation holds a reported US$652 million in mixed assets; 61% in BTC, 15% in XTZ, 15% in bonds, ETFs, and commodities at Swiss banks, 6% in fiat, and 3% in other assets
Following the ICO, a dispute between then Tezos Foundation president Johann Gevers and the Breitmans pushed initial development back multiple months. Additionally, in October 2017, a class-action lawsuit was registered against Tezos in the Superior Court of California, citing "violation of the registration and anti-fraud provisions of the federal securities laws, as well as state false advertising, and unfair competition laws."
In June 2018, Tezos announced they would be requiring user identification to satisfy Know Your Customer/Anti-Money Laundering (KYC/AML) laws, information that wasn’t initially collected during the ICO. The genesis block was also completed in June 2018, with 608 million XTZ created and no limit on the total XTZ supply. The mainnet went live in September 2018 with user ICO tokens unlocking in November 2018.
The Tezos ledger uses a delegated Proof of Stake consensus mechanism with a target block time of one minute and current annual inflation of 5.5%. Nearly 76% of the current circulating supply is participating in staking, or ‘baking’ on the XTZ chain, which is among the highest total USD value of all PoS chains.

Source: StakingRewards
There are seven exchange bakeries, with Coinbase holding the lion’s share. In total, just over 10% of the Tezos circulating supply is held on exchange bakeries. Initially, bakers needed at least 10,000 XTZ, or US$15,810 at current prices, to become a delegate. Users with less than 10,000 XTZ could also participate in staking through delegation services.

Bakers participate and manage XTZ nodes and protocol amendments, as well as software updates and patches. Bakers also charge delegators for their services as network amenders and block producers. At the beginning of each cycle (4,096 blocks or about three days), the Bakers for each block are randomly selected and published. Bakers earn a block reward of 16 XTZ for baking a block. In addition to the Baker, 32 Endorsers are randomly selected to verify the last block that was baked. Endorsers receive 2 XTZ for each block they endorse.

Source: MyTezosBaker
Protocol amendments are adopted over election cycles every 131,072 blocks, or about every three months. Amendments are only voted on by the community, and not the Tezos Foundation. In late May, the XTZ community voted to activate Athens, the first XTZ on-chain governance proposal. Athens increased the gas limit to allow for larger transaction throughput and reduced the minimum amount of XTZ required to bake, from 10,000 XTZ to 8,000 XTZ.
In the last round of voting, the Brest amendment was rejected. The Babylon 2.0 amendment is currently being voted on and will likely be implemented in October. The Babylon upgrades include; changing the consensus algorithm to Emmy+, which would make it easier to write smart contracts in the scripting language Michelson, distinguishing accounts from smart contracts, and changing quorum floors and caps.

Source: Tezos Blog
On the network, the current total number of transactions per day (line, chart below) has ranged from 30,000 to 38,000 since the beginning of the year. Average transaction fees (fill, chart below) ranged from US$0.0001 to US$0.0007 for most of the year, doubling increasing recently to US$0.0015. Average transaction values have also increased from just under US$300 to just above US$5,000 since November (not shown).

Source: CoinMetrics
The 30-day Kalichkin network value to estimated on-chain daily transactions (NVT) ratio (line, chart below) is currently 197 and falling, while currently near the middle of the historic norm.
Inflection points in NVT can be leading indicators of a reversal in asset value. An uptrend in NVT often suggests a coin is overvalued based on its economic activity and utility, which should be seen as a bearish price indicator, whereas a downtrend in NVT suggests the opposite. NVT below 100 typically indicates organic and sustained bull market conditions.
Active and unique addresses also are important to consider, specifically when determining the fundamental value of the network based on Metcalfe's law. Monthly active addresses (MAAs) have continued to increase since January 2019 (fill, chart below). In November 2018, addresses spiked due to the release of the claimed tokens from the ICO. A consistent and sustained increase in MAAs paints a bullish picture for any asset.

Source: CoinMetrics
The XTZ project is programmed in OCaml with the main repo on GitLab recording nearly 3,800 commits over the past year (shown below). As of early this month, the Tezos Foundation reported 1,338 developers have completed or are working to complete the Tezos training course.
Most coins use the developer community of Github or GitLab where files are saved in folders called "repositories," or "repos," and changes to these files are recorded with "commits," which save a record of what changes were made, when, and by who. Although commits represent quantity and not necessarily quality, a higher number of commits can signify higher dev activity and interest.

Source: GitLab
In the markets, XTZ exchange volume has been led by the BTC, USD, and USDT pairs on Kraken and Coinbase. The USDT pair currently holds a 0.6% premium over the USD pair. XTZ was listed on HitBTC in July 2017, Gate.io in July 2018, Bitfinex in September 2018, Kraken in October 2018, Huobi in December 2018, Coinbase and eToro in August 2019, Binance in September 2019, OKEx in November 2019, and Bittrex this week. Bitfinex also added XTZ/USD and XTZ/BTC margin pairs in August. XTZ is not currently listed on Gemini or Poloniex. Binance, Coinbase, Coinone, Gate.io, Kraken, Kucoin, OKEx, and the Trezor and Ledger hardware wallets provide staking support for XTZ.

Worldwide Google Trends data for the term "tezos" increased slightly beginning in March this year, around the voting of the Athens amendment, which is also reflected in the price of the asset. The July 2017 spike in “tezos” searches corresponds with the project’s ICO. The most recent search spike corresponds with the several exchange listings over the past few months.
Google Trends data has been found to have some correlation with crypto prices. A 2015 study found a strong correlation between the Google Trends data and BTC price, while a 2017 study concluded that when the U.S. Google "bitcoin" searches increased dramatically, BTC price dropped.

Technical Analysis
XTZ price data is limited to less than one year, with the most significant bullish rallies gravitating around the voting completion and implementation of the Athens amendment, as well as several exchange listings. Any future trends, as well as support and resistance levels, can be evaluated using exponential moving averages, volume profiles, and the Ichimoku Cloud. Further background information on the technical indicators discussed below can be found here.
On the daily chart for the XTZ/USD pair, the 50-day Exponential Moving Average (EMA) and 200-day EMA crossed bullish on November 18th, which was followed by a 50% bullish rally. Thus far, the US$2.00 zone appears to be heavy psychological resistance. Historical volume support (horizontal bars) shows support at US$1.23.
Bitfinex open interest is 84% short (top panel, chart below), with short positions rising rapidly and reaching an all-time high earlier this week. A significant price movement upwards will result in an exaggerated move as the short positions will begin to unwind. There is a growing and active two-month bearish volume and RSI divergence suggestive of waning bullish momentum.

Turning to the Ichimoku Cloud, four metrics are used to indicate if a trend exists; the current price in relation to the Cloud, the color of the Cloud (red for bearish, green for bullish), the Tenkan (T) and Kijun (K) cross, and the Lagging Span. The best entry always occurs when most of the signals flip from bearish to bullish, or vice versa.
Cloud metrics on the daily time frame, with doubled settings (20/60/120/30) for more accurate signals, are currently bullish; price is above the Cloud, the Cloud is bullish, the TK cross is bullish, and the Lagging Span is above the Cloud and above price. The current TK disequilibrium (c-clamp) suggests mild overbought conditions. A traditional long re-entry signal will trigger once price returns to the Kijun at US$1.30.

On the daily chart for the XTZ/BTC pair, price broke above both the 200-day EMA and daily Cloud on november 7th, leading to a 108% bull rally. Cloud metrics are also currently all bullish, however, the TK disequilibrium (c-clamp) suggests extreme overbought conditions. Historic volume support sits at the psychological zone of 20,000 sats. There is also a bearish RSI divergence suggestive of waning bullish momentum. Price will likely need to reconsolidate near the all-time high zone before further attempts at higher highs. Bitfinex open interest is 93% short (not shown).

Conclusion
After a rocky start, XTZ enters a crowded field of PoS coins with the hopes of solving crippling governance issues which have previously plagued both BTC and ETH. Fundamentals reflect a nascent chain with slightly rising daily transactions and uptrending active addresses over the past year.The high percentage of staked circulating supply, at nearly 75%, may suggest there is not much else to do with XTZ currently, as smart contracts and dapps have yet to take hold. The high staking percentage is likely directly related to several exchanges and custody services allowing for staking participation. Currently, just over 10% of the XTZ circulating supply is held by exchange bakeries. As most exchanges have both listed XTZ and announced staking support, further upside may be limited until additional fundamental events can fuel speculation to a new all-time high.
Technicals for the XTZ/USD pair are bullish as trend metrics are strongly in favor of a definitive bullish trend. XTZ is one of the few coins spot prices prices above both the daily 200-EMA and daily Cloud. Upside resistance sits at the psychological resistance of US$2.00 before the asset enters price discovery mode. A 1.618 fib extension drawn from all-time high to all-time low yields a potential price target of US$3.95. Strong price support currently sits at US$1.30 based on the daily Kijun and volume profile.
Technicals for the XTZ/BTC suggest a strong but heavily overbought bullish rally. Again, this pair sits high above both the daily 200-EMA and daily Cloud. Strong upside resistance sits at the all-time high range of 25,000 sats - 30,000 sats whereas support sits at the psychological level of 20,000 sats.
OhNoCrypto
via https://www.ohnocrypto.com
Josh Olszewicz, Khareem Sudlow
