Data Snippet - Bullish trend shift for top three assets
Annual quarters often see a dramatic expansion or contraction in spot prices for any crypto asset. Q2 and Q4 of any given year have historically been the most positive periods, while Q1 and Q3 have been the most negative periods.
Q2 is typically the best performing quarter for cryptocurrencies. Bitcoin (BTC) has averaged +52% during Q2, excluding 2011.
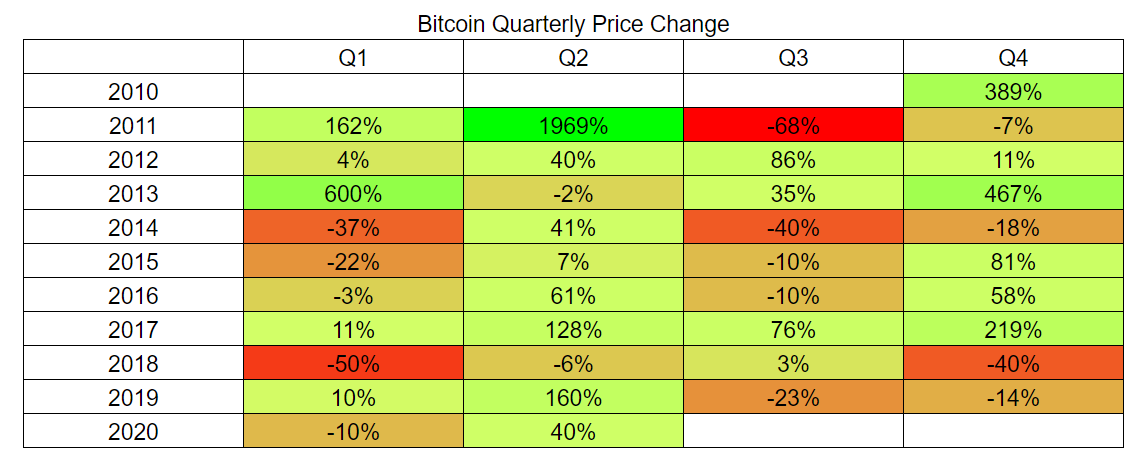
Ethereum (ETH) has seen positive quarters that fit into three ranges: <+15%, around +100%, or >+500%, suggesting the potential for a +100% close to this quarter.

Most of the positive Ripple (XRP) quarters have closed around +50%, with four positive quarters closing with more than 200% in gains.

Moving Averages
Trend trading decisions are dominated by moving average strategies. The litmus test for a bullish or bearish trend in any market is the 200-day moving average. Price action above the 200-day moving average is considered bullish territory, whereas price action below the 200-day moving average is considered bearish territory. This key average has historically held significant significance for Bitcoin, Ethereum, and Ripple.
Adding a 50-day moving average to the trend system also helps elucidate the strength or weakness of a trend. The 50-day and 200-day moving average crosses are referred to a Golden Cross or Death Cross, signifying bullish or bearish conditions, respectively.
These crosses typically appear late, retrospectively, but always garner attention for any trend trader. These crosses alone also do not represent immediate trading signals, but add to bullish or bearish confluence.
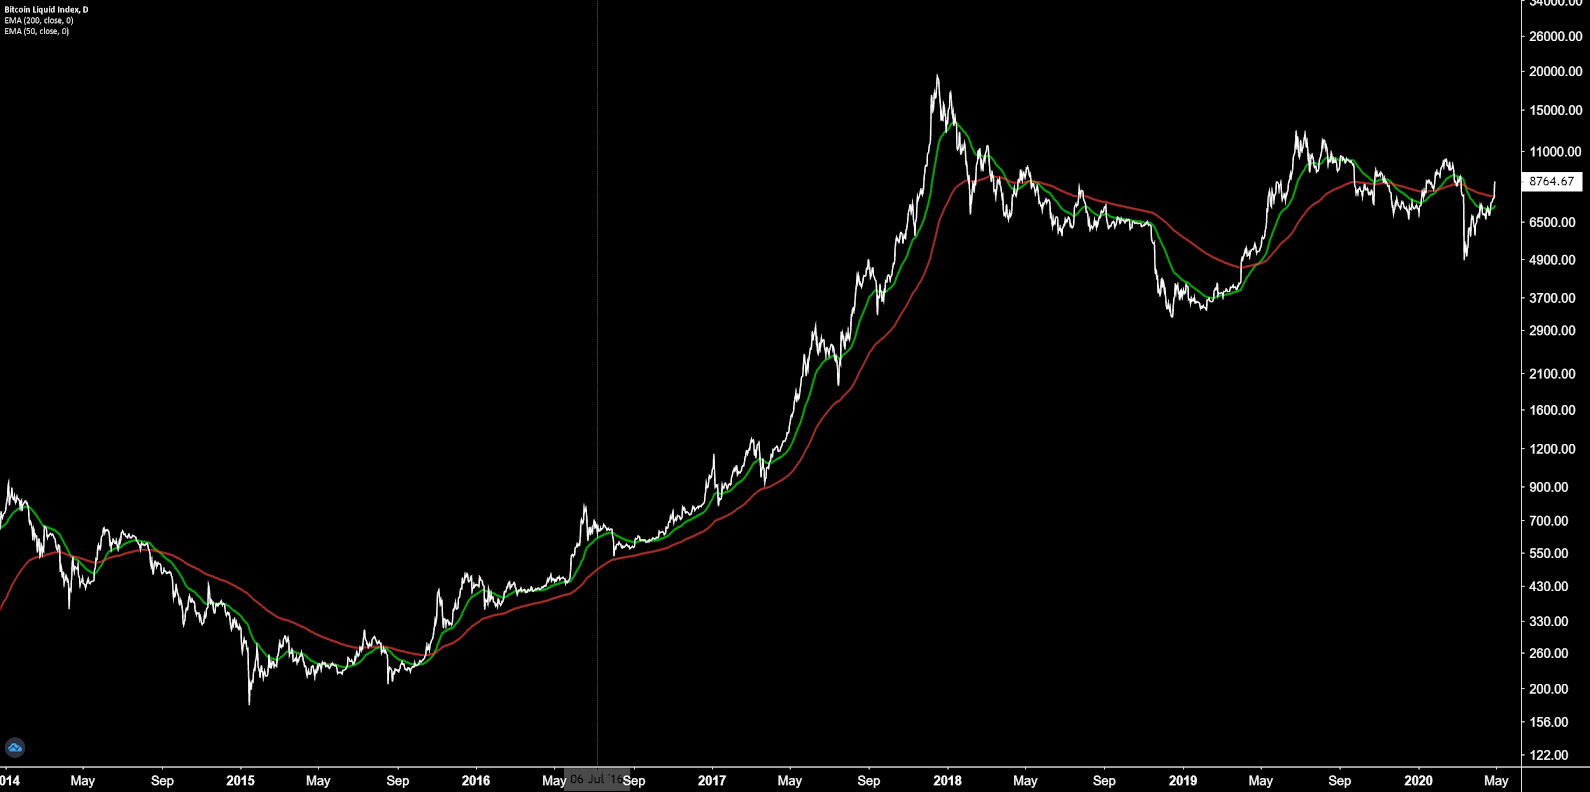
This week, Bitcoin moved back above the 200-day moving average, suggesting bull market conditions. Since 2015, Bitcoin has had only eight such crosses; four Golden Crosses and four Death Crosses. The 2016 bullish trend, beginning before the last halving in 2016, continued for nearly 900 days straight. The Golden Cross in May 2018 lasted only one week before bearish continuation.
Based on these key crosses as a trend determination criteria, the bear trend in 2018 ended after 340 days while the bull trend in 2019 ended after 220 days. Each other trend in 2019 and 2020 has lasted under 100 days. A Golden Cross for Bitcoin is likely over the next few weeks, once again solidifying the strength of the bullish trend.
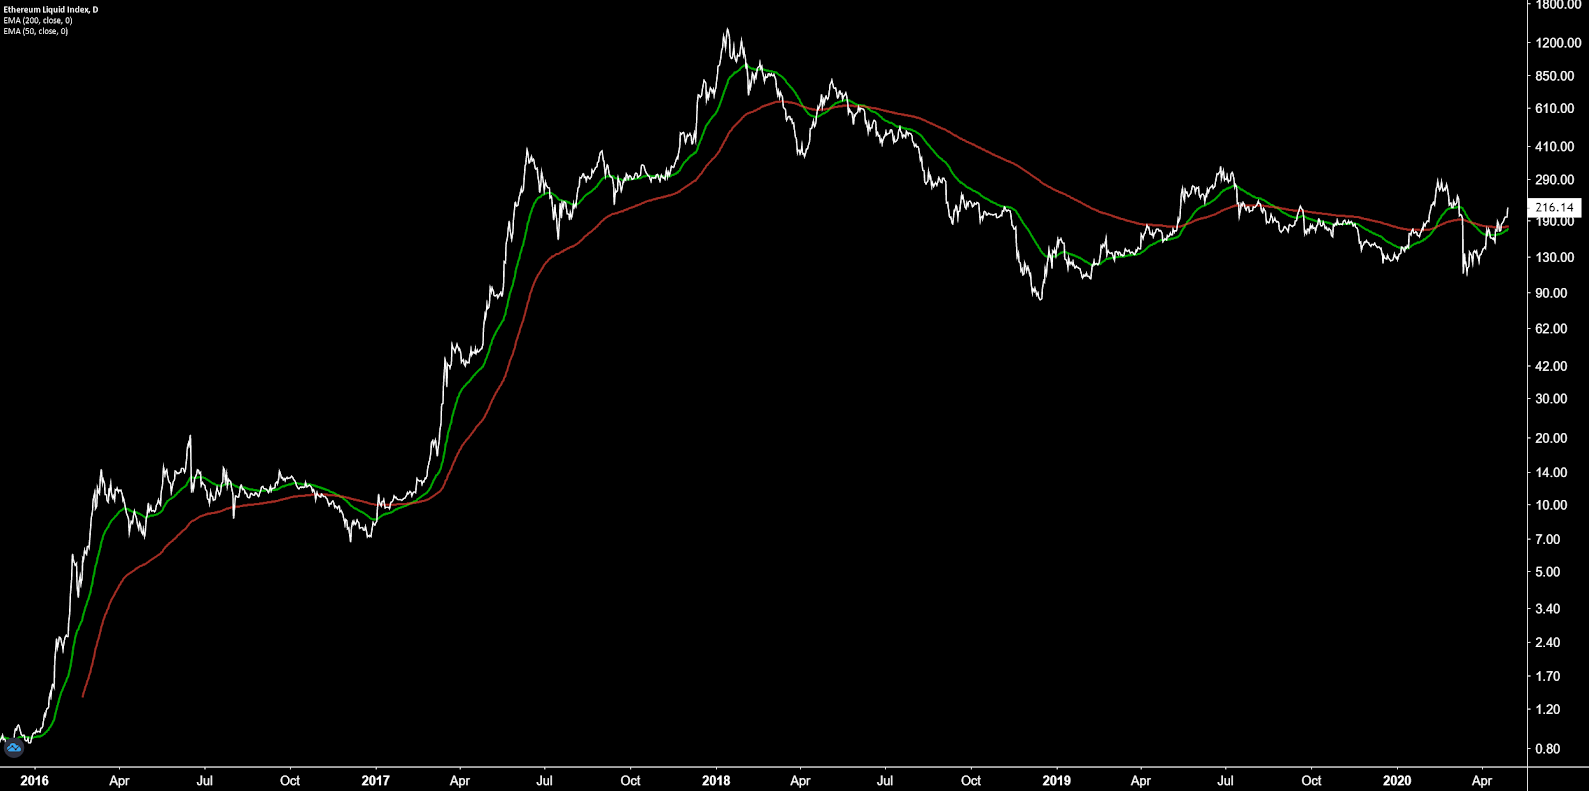
Similar to Bitcoin, Ethereum definitively crossed above the 200-day moving average over the past week. Since 2017, Ethereum has had four Golden Crosses and four Death Crosses. Any extended trend has lasted for at over 150 days whereas five mini-trends have lasted under 100 days. A Golden Cross for Ethereum is likely over the next few days, once again solidifying the strength of the bullish trend.
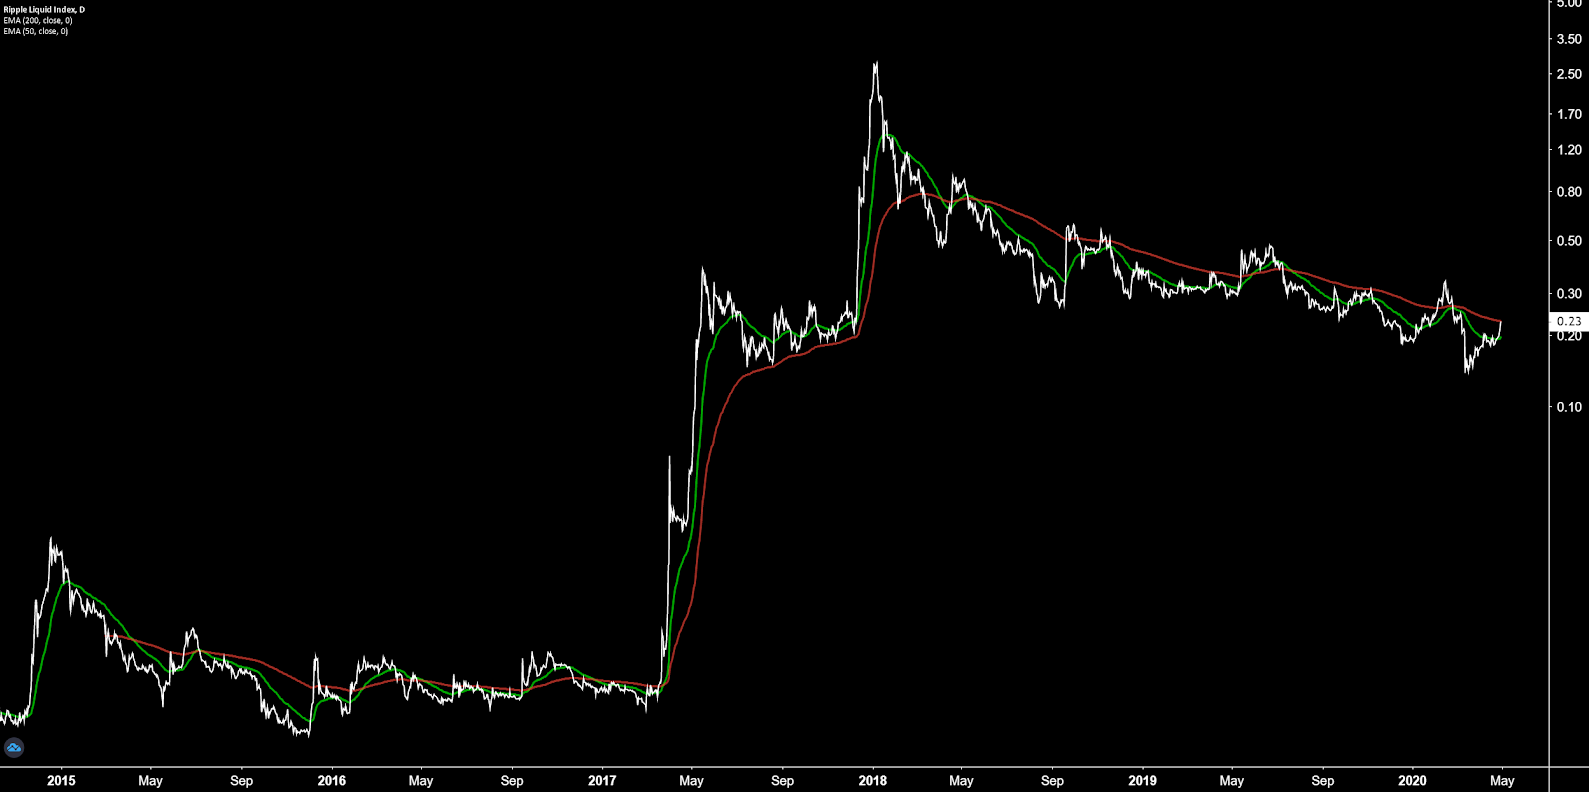
Ripple is currently at the 200-day moving average. Since 2017, Ripple has had three Golden Crosses and three Death Crosses. Aside from the 372-day bullish trend starting in 2017, all other bullish trends have lasted under 50 days, whereas the bearish trends have lasted 300 days. Over the next few weeks, Ripple will likely lag behind Bitcoin and Ethereum while attempting to breach the 200-day moving average and complete a Golden Cross.
Ichimoku Cloud
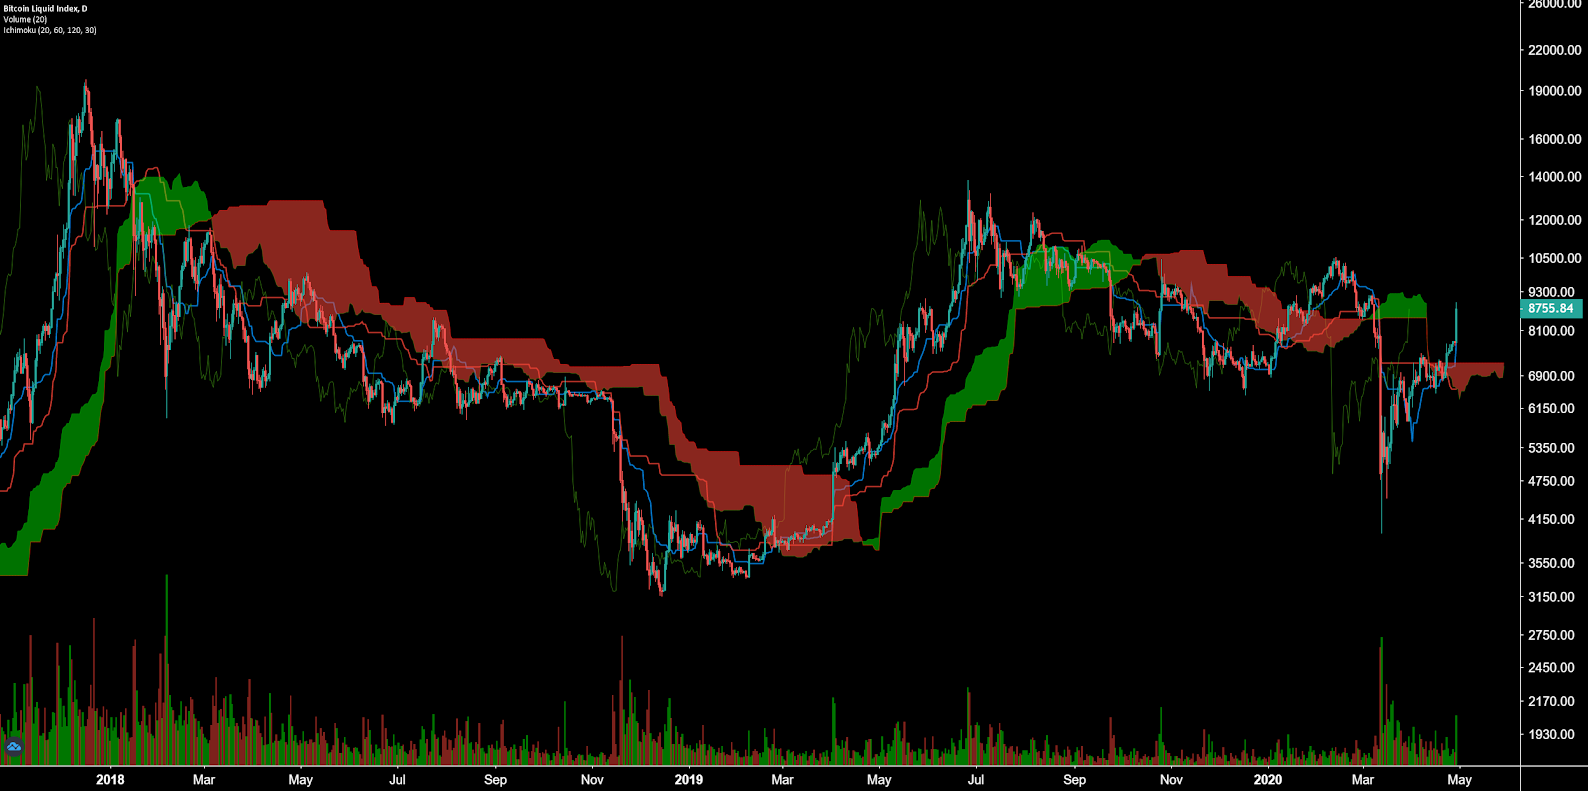
The Ichimoku Cloud is another useful tool for trend determination. The Cloud consists of four metrics to indicate if a trend exists as shown in above chart; the current price in relation to the Cloud, the color of the Cloud (red for bearish, green for bullish), the Tenkan (T) and Kijun (K) cross, and the Lagging Span. The best entry always occurs when most of the signals flip from bearish to bullish, or vice versa.
Bitcoin’s Cloud metrics with 20/60/120/30 settings on the daily time frame are nearly 100% bullish;
- The spot price is above the Cloud for the first time since late February.
- The Cloud is bearish but will likely cross bullish over the next two days.
- The TK cross is bullish.
- The Lagging Span is inside of the Cloud and above the current spot price.
As the spot price moves higher and higher, the Kijun will move up to meet the spot price very slowly. Typically, price will either consolidate sideways, or return to meet the Kijun during any given trend. The Kijun is currently around US$6,650, suggesting a mean reversion target to that level. The flat Cloud at US$7,200 will also act as a support for price if selling increases over the next two weeks.
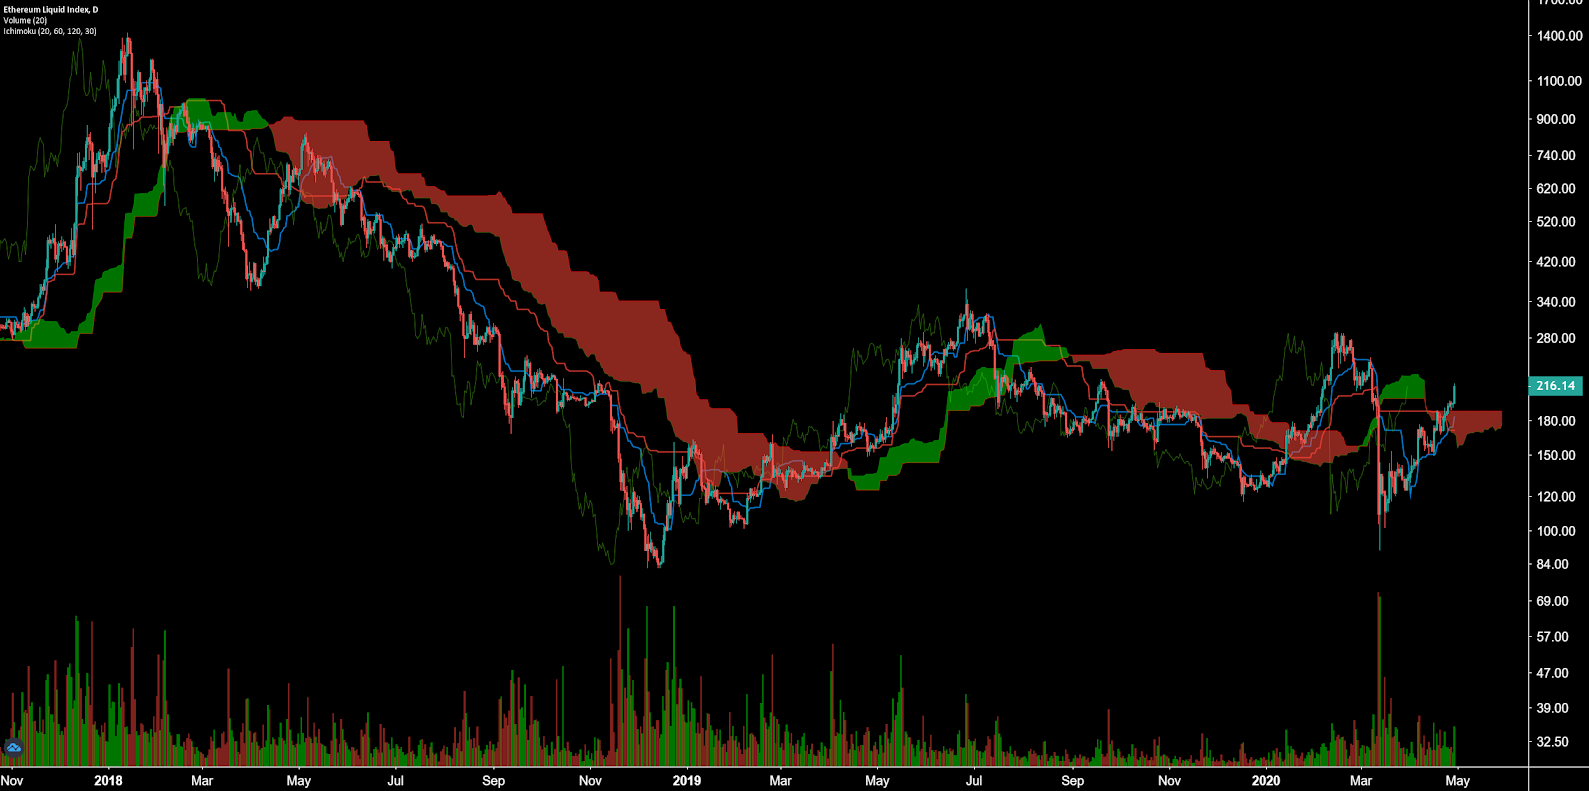
Ethereum’s Cloud metrics with 20/60/120/30 settings on the daily time frame are also nearly 100% bullish;
- The spot price is above the Cloud for the first time since late February.
- The Cloud is bearish but will likely cross bullish over the next week.
- The TK cross is bullish.
- The Lagging Span is inside of the Cloud and above the current spot price.
Similar to Bitcoin, Ethereum’s Kijun is far below the current spot price, at US$171. Ethereum is more likely to consolidate rather than move higher, until the Kijun catches up with price. The flat Cloud at US$190 will also act as a support if selling increases over the next two weeks.
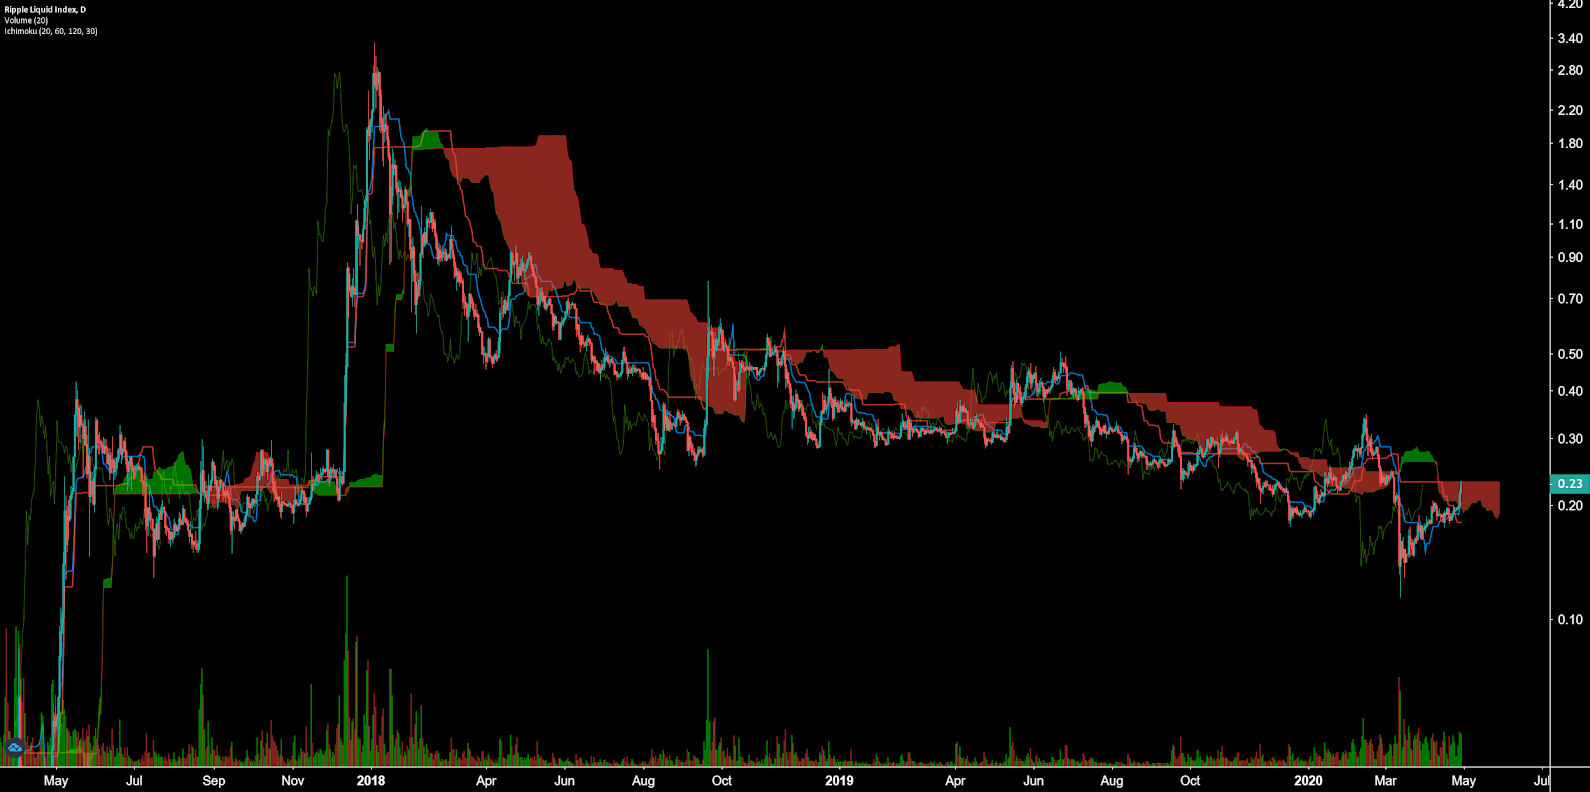
Ripple’s Cloud metrics with 20/60/120/30 settings on the daily time frame are neutral;
- The spot price is nearly above the Cloud for the first time since late February.
- The Cloud is bearish but will likely cross bullish over the next two days.
- The TK cross is bullish.
- The Lagging Span is below the Cloud and above the current spot price.
Ripple’s Cloud metrics are still waiting for a bullish breakout, as we’ve seen with Bitcoin and Ethereum. Prices above US$0.23 should provide confidence to bullish traders over the next few weeks. Ripple’s Kijun, at US$0.18, will also need to move up, along with the spot price, in order to negate the threat of a swift mean reversion.
OhNoCrypto
via https://www.ohnocrypto.com
Josh Olszewicz, Khareem Sudlow
