Ethereum Classic Price Analysis - Little change after block reward reduction
Ethereum Classic (ETC) is a distributed ledger and decentralized computing platform with smart contract capabilities, created in 2016 by forking the original Ethereum (ETH) project. The crypto asset is currently 20th on the Brave New Coin market cap table, with a market cap of US$624 million and US$344 million in trade volume over the past 24 hours. The ETC/USD spot price is down 89% from the all-time high set in mid-January 2018.
ETC was created after a contentious hard fork, following the Decentralized Autonomous Organization (DAO) hack in June 2016, which led to approximately US$50 million being drained from the DAO through recursive call attacks. The DAO was originally established as a venture capital fund built on Ethereum and launched with a crowd sale in April 2016. As of May 2016, the fund held ~14% of the Ethereum total supply, roughly ~US$150 million, from 11,000 investors.
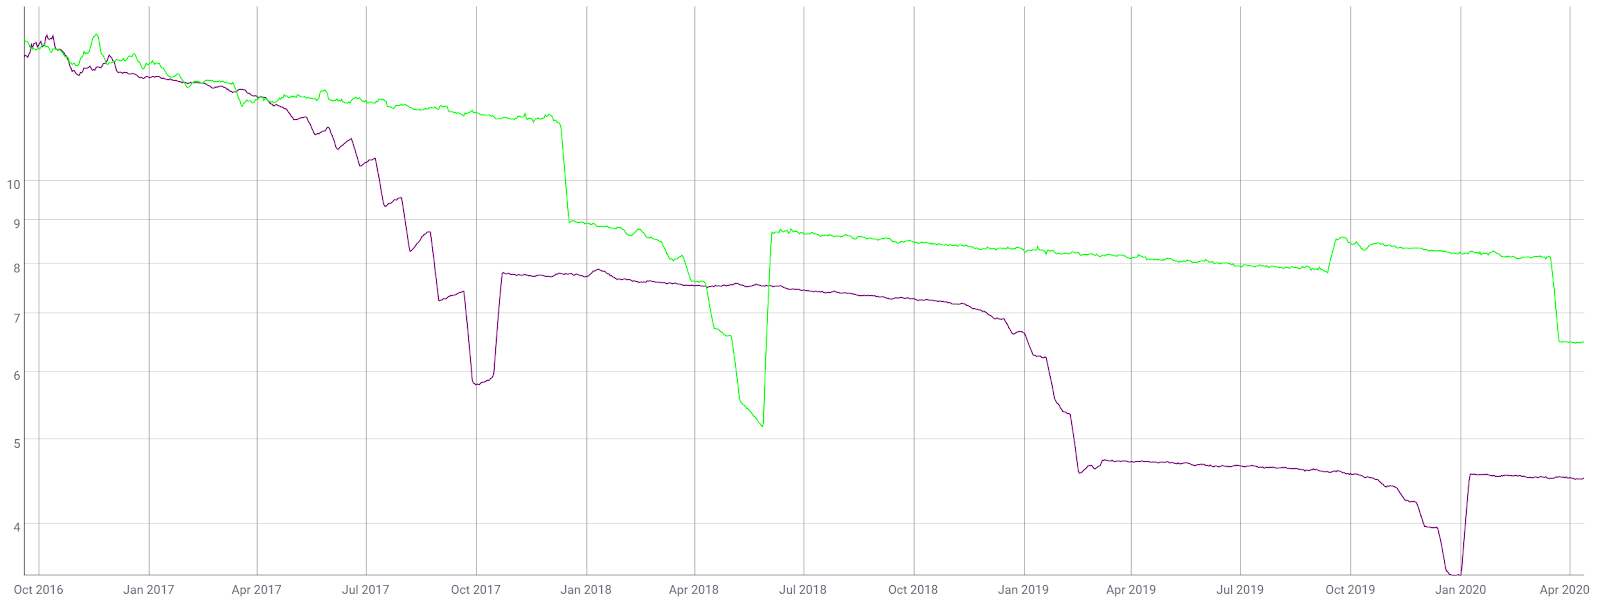
To recoup the lost funds, a hard fork of the original Ethereum chain quickly followed the hack. The original chain survived, in large part due to exchange listings, and was renamed Ethereum Classic. ETC proponents questioned the immutability of the ETH ledger after the hard fork solution was implemented. Additionally, the ETC developers and community agreed to cap issuance and decrease the block reward. Annual inflation on the network currently stands at 6.50% (green) compared to ETH’s 4.52% (purple). For ETC, the total block reward is reduced by 20% every five million blocks.
Barry Silbert, the founder and CEO of Digital Currency Group (DCG), was one of the most prominent members of the community to embrace ETC and encourage future development, through then Hong Kong-based IOHK. In 2019, IOHK announced the company would be moving to the state of Wyoming due to a friendlier regulatory environment.
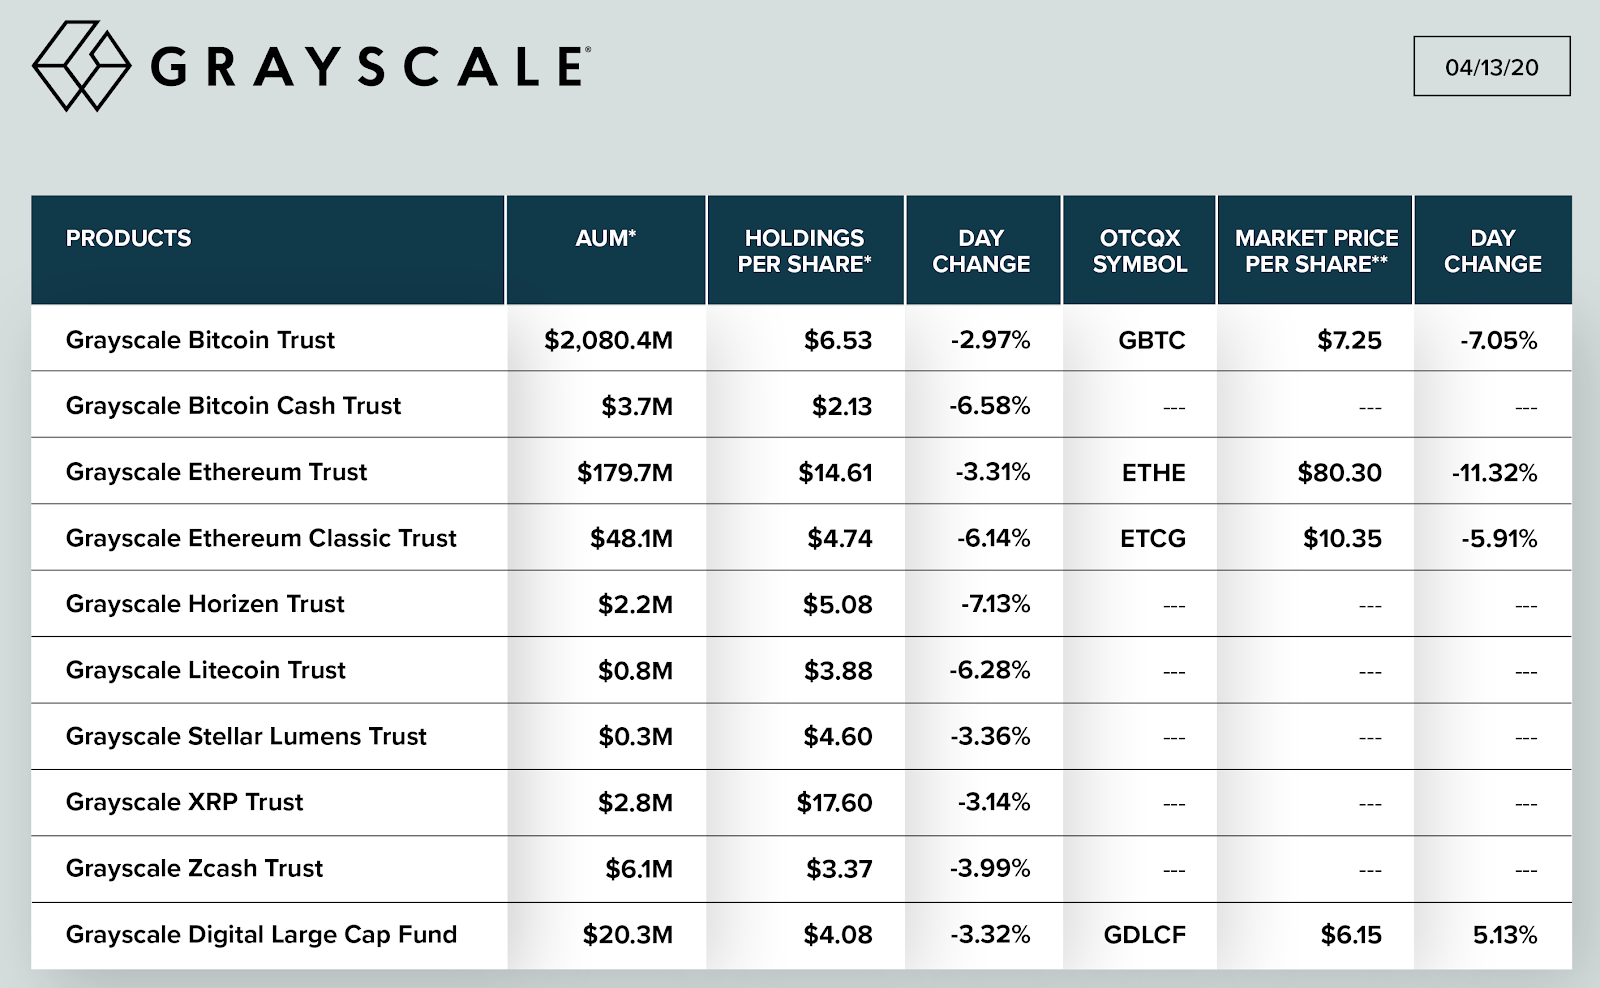
A subsidiary of DCG, Grayscale, comprises several funds which issue shares backed by crypto. The trust that issues shares for an ETC product currently has US$62.0 million in assets under management, representing 9,284,238 ETC, or 7.82% of the circulating supply. Managers of the trust intend to direct up to one-third of the Annual Fee, for the first three years of the trust's operations, towards the Ethereum Classic Cooperative, which has initiatives supporting development, marketing, and community activities.
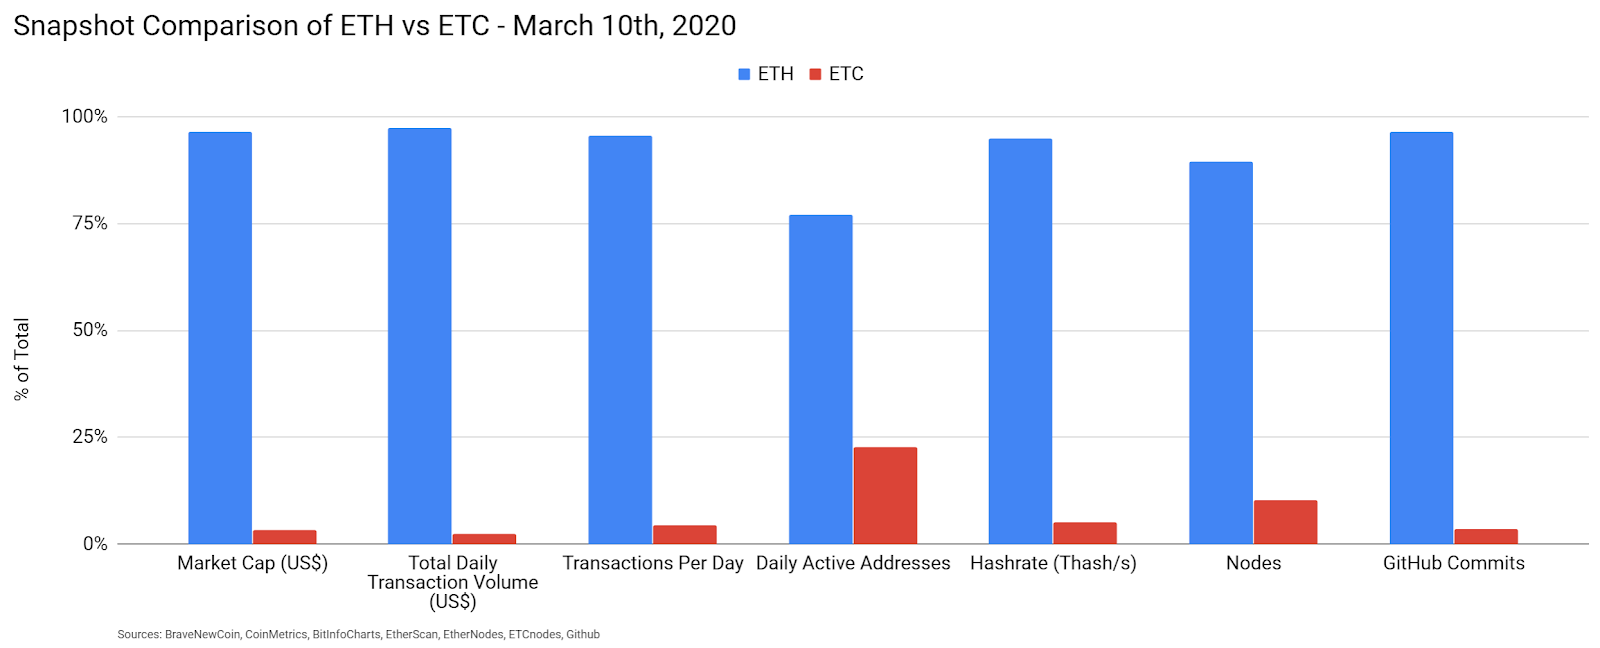
A quick comparison between Ethereum and Ethereum Classic shows Ethereum dominating by all metrics, including market cap, daily transaction volume, daily transactions, daily active addresses, hash rate, nodes, and Github commits on the main repo over the past year.
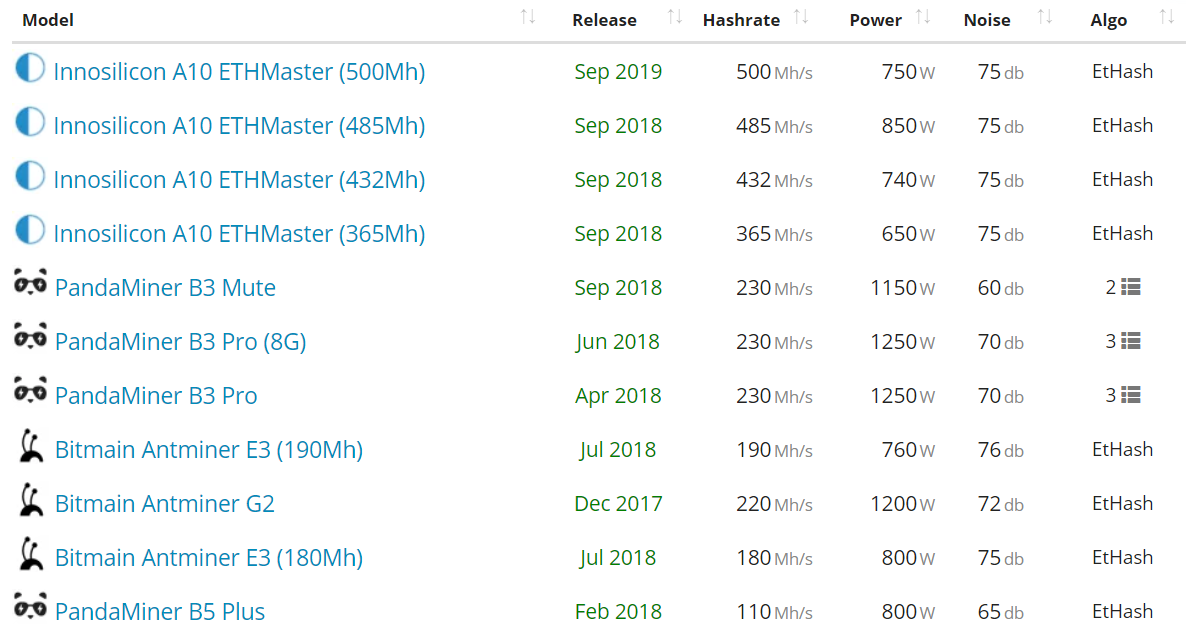
Mining activity over the past few years has increased substantially thanks to ASICs for the Ethash consensus algorithm developed by Innosilicon, Bitmain, and PandMiner. Linzhi, a new Ethash ASIC manufacturer, released its first miner in September 2019.
As Ethereum transitions to a new consensus algorithm, ProgPoW, ASIC miners may migrate en masse to the ETC chain, as they will not be able to profitably mine on the Ethereum chain. Further, the Ethash ASIC manufacturer Linzhi also recently released a new Ethash ASIC. Those who purchased these ASICs will be looking to obtain a return on their investment, regardless of which chain they are mining.
Hash rate hit an all-time high in February but has since returned to the previous range. The rise in hash rate also correlated with a rise in ETC price at that time. As opposed to ETH, ETC is unlikely to ever implement Proof of Stake (PoS) and will likely remain a Proof of Work (PoW) chain for the indefinite future. Over the past few months, the ETC hash rate has continued to gain ground on the ETH hash rate. However, ETC’s hash rate still only represents 5.3% of ETH’s hash rate (not shown).

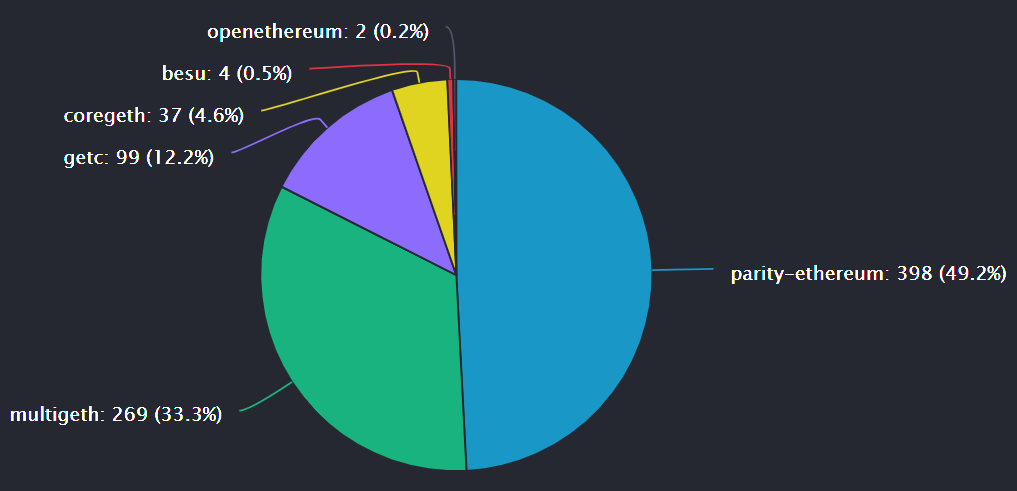
The ETC network has a total of 809 active nodes, most of which are currently running the parity client. The United States, China, and Germany are home to 26%, 15%, and 11% of these nodes, respectively. Nearly 76% of the nodes are running on Cloud networks, such as Amazon, Alibaba, and Google.
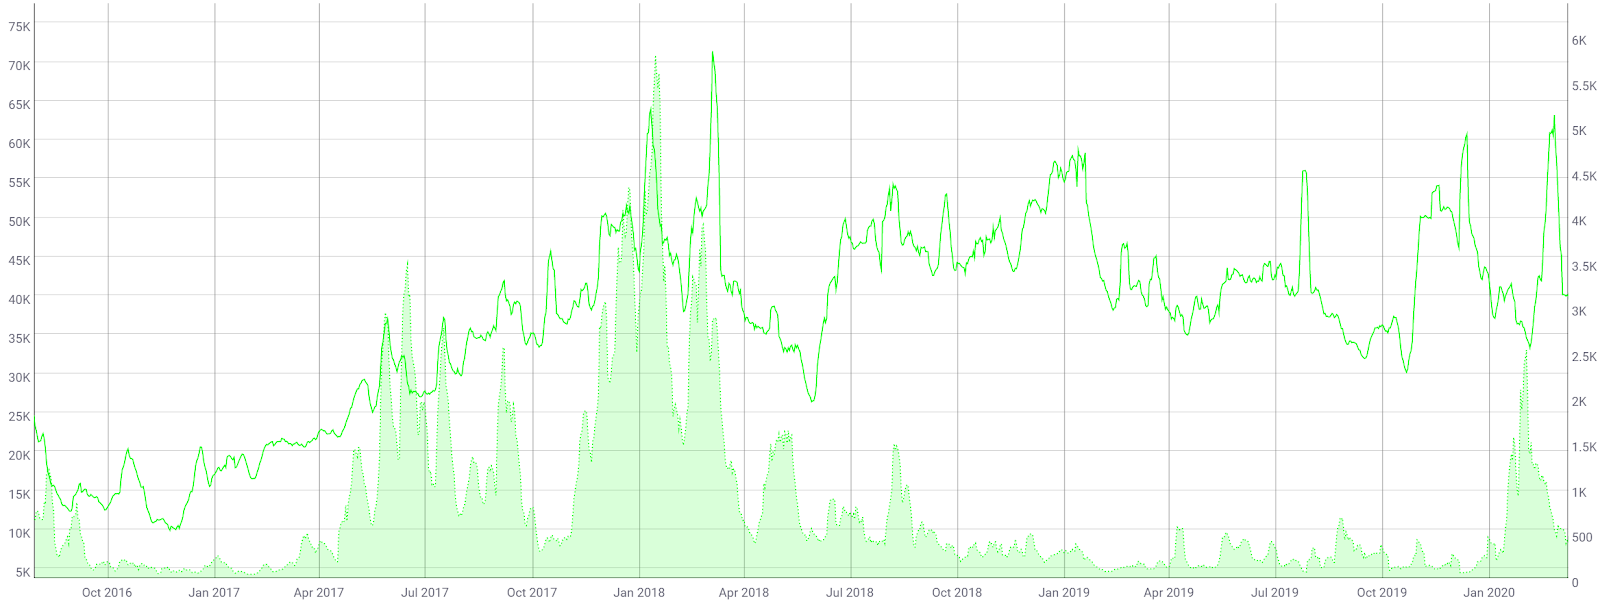
The number of ETC on-chain transactions per day (line, chart below) has ranged from 26,000 to 60,000 since April 2018. Transactions per day hit an all-time high in March 2018 after breaching the 100,000 mark. Any significant uptick in transactions per day should be seen as a bullish indicator. However, the most recent upticks in transactions per day have not been a sustained increase and have not led to a multi-month bullish rally.
The average transaction value per day (fill, chart below) increased dramatically from January to February but has since returned to the previous range between US$100 to US$600. The average transaction value hit an all-time high in mid-January 2018, at nearly US$6,000, which corresponded with an all-time high in token pricing. Transaction fees are currently US$0.00094 (not shown).
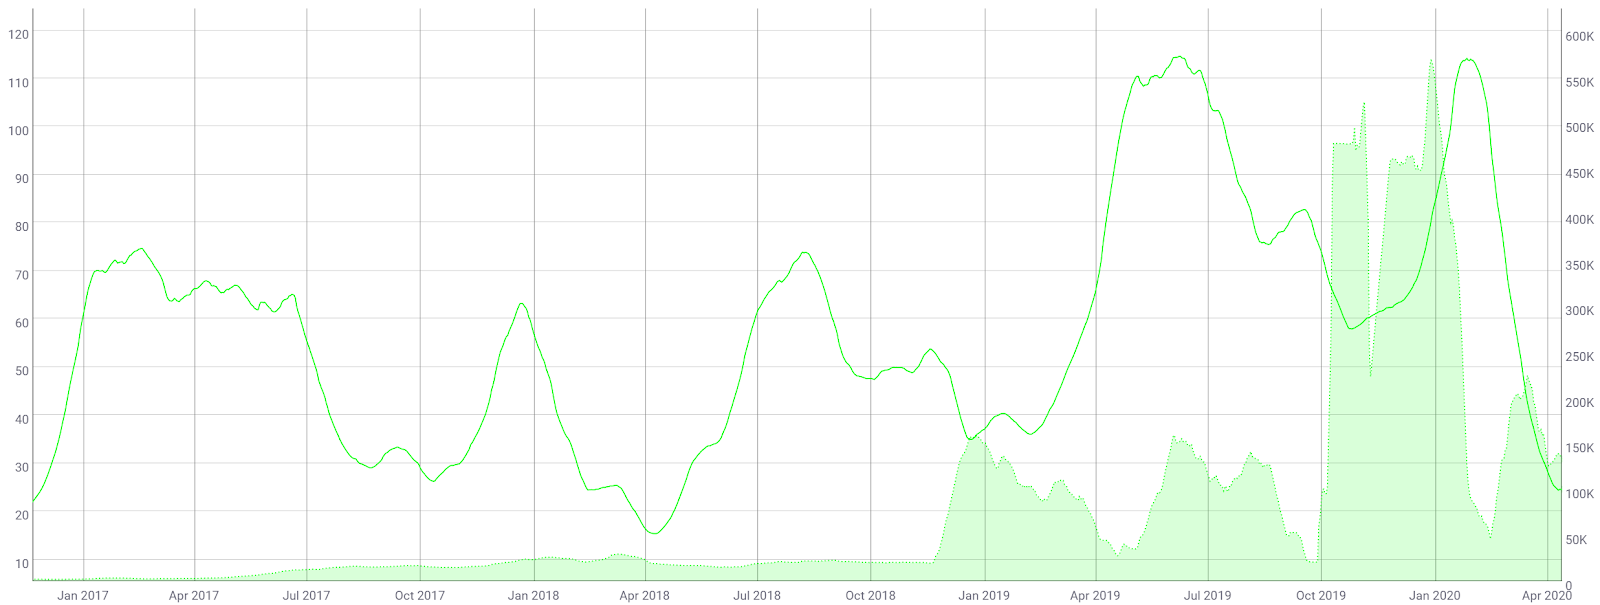
The 30-day Kalichkin network value to estimated on-chain daily transactions (NVT) ratio (line, chart below) decreased from 115 to 25 over the past few months, after nearing record highs. An NVT below 40 is consistent with bull market conditions.
A clear uptrend in NVT suggests a coin is overvalued based on its economic activity and network utility, which should be seen as a bearish price indicator. Additionally, a decreasing NVT in a bear market suggests the asset is currently oversold, or that the NVT metric may need to be retooled to better understand market variables.
Daily active addresses (DAAs) spiked dramatically in late 2018 and held near record levels through most of 2019 (fill, chart below). In October 2019, DAAs spiked to 4.7 million before dropping back to the previous range of 10,000 - 200,000. These addresses may represent a mixing service or a network test. Since October, DAAs have been highly volatile, ranging from 9,000 to 1.1 million. In general, a sustained uptick in DAAs should be seen as a bullish indicator as this indicates increased blockchain use and interest. The inverse suggests a declining interest in the chain and ecosystem.
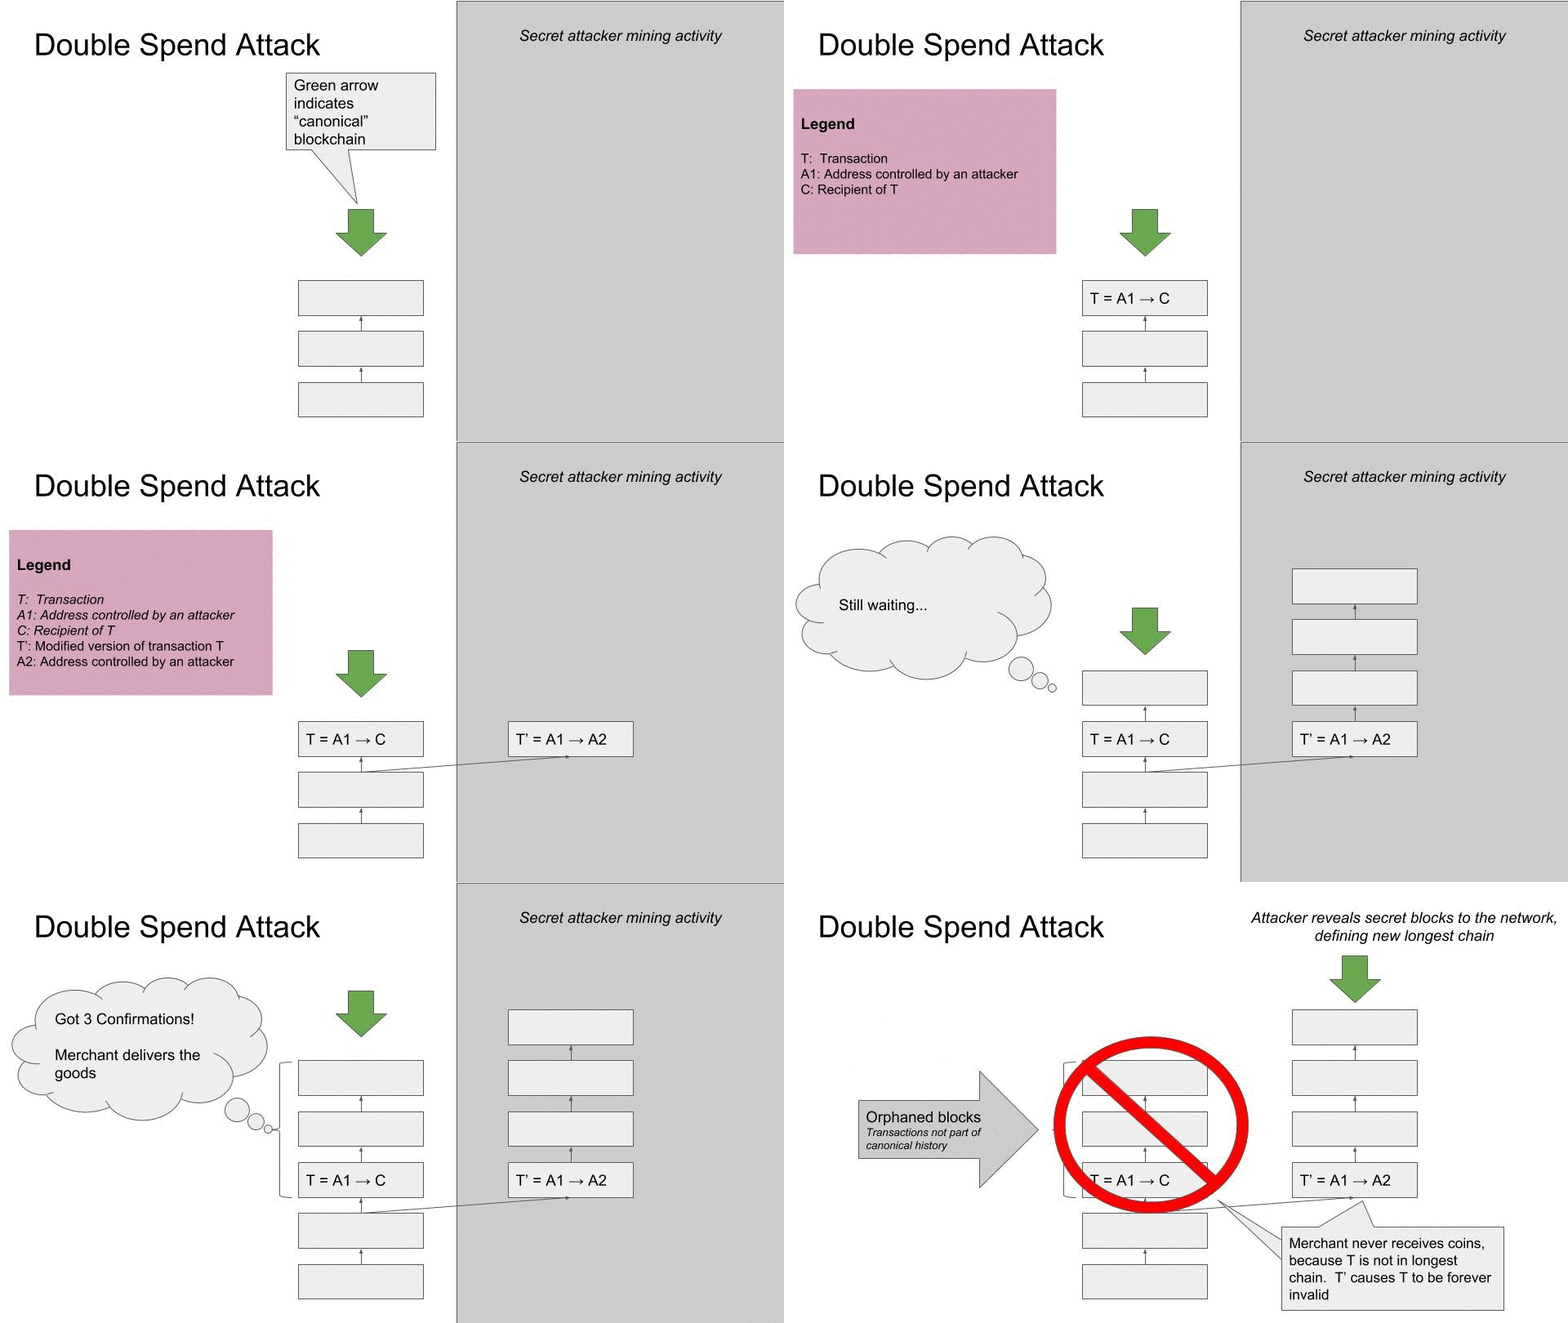
In January 2019, ETC suffered a 51% attack via “deep chain reorganization.” Mark Nesbitt, a security engineer at Coinbase, alerted the community of the attack with a blog post explaining the matter. Coinbase disabled ETC transfers at the time, and subsequently re-enabled them on March 11th. The trading platform now requires 5,676 confirmations for ETC deposits, which would take about 24 hours in normal conditions.
The attack resulted in double-spends for 219,500 ETC, which was around ~US$1.1 million, according to the blog post. Shortly after the attack, a site designed to monitor the status of any potential 51% attack was released by ETC Labs. Hashrate has remained relatively stable since the incident.
Exchanges are typically the most vulnerable and biggest targets during a 51% attack. Gate.io reported the theft of 40,000 ETC, which was around ~US$200,000. A few days later, US$100,000 in ETC was returned to the exchange with no explanation. Bittrue announced that there was an attempt to withdraw 13,000 ETC during the 51% attack, but the withdrawal was stopped by exchange-side countermeasures.
Turning to developer activity, the ETC project on Github is split between “ethereumclassic” and “etclabscore.” ETC Labs Core rebranded to ETC Core in December 2019, to avoid confusion with ETC Labs. The most historically active repos have had relatively few commits over the past year (shown below). The Ethereum Classic Improvement Protocol (ECIP) repos have been the most active over the past few months.
The most recent network upgrades have implemented changes already active on the Ethereum main-net. _Atlantis_, ECIP-1054, and _Agharta_, ECIP-1056, were successfully implemented on the ETC main-net on September 12th and January 13th, respectively. Both protocol changes occurred via a hard fork and increased interoperability between the ETC and ETH chains.
The next protocol change, _Phoenix_, is set to be implemented on ETC main-net around June 10th, 2020. Changes include six EIPs already active on Ethereum; adding the Blake2 compression function precompile, reducing alt_bn128 precompile gas costs, adding ChainID opcode, repricing for trie-size-dependent opcodes, calldata gas cost reduction, and rebalancing net-metered SSTORE gas cost with consideration of SLOAD gas cost change.
Most coins use this development platform, where files are saved in folders called "repositories," or "repos," and changes to these files are recorded with "commits," which save a record of what changes were made, when, and by who. Although commits represent quantity and not necessarily quality, a higher number of commits can signify higher dev activity and interest.


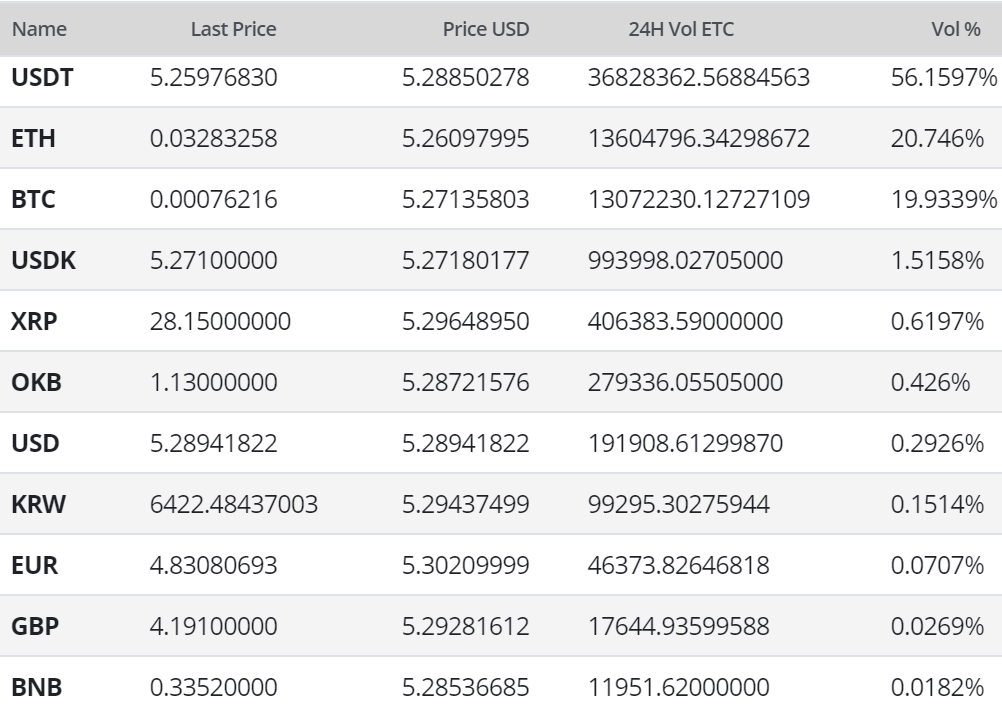
In the markets, ETC exchange-traded volume over the past 24 hours has predominantly been led by the Tether (USDT), Ethereum (ETH), and Bitcoin (BTC) pairs on OKEx and Binance. The Korean Won (KRW) pair currently holds only a slight premium over the USD pair.
Although many exchanges paused ETC deposits and withdrawals in January 2019, during the 51% attack, trading has since resumed. In April, Poloniex enabled ETC/BTC margin trading up to 2.5x leverage for non-U.S. customers. ETC/BTC and ETC/USD pairs were added to ETHfinex in May. The recently launched Binance.US enabled ETC/USDT and ETC/USD trading pairs in September. Binance.com delisted the ETC/USDC and ETC/TUSD pairs in November and December, respectively, and OKEx listed an ETC/USDT pair in December.
Technical Analysis
The 51% attack in January 2019 seems to have had no long term impact on ETC price. Since the December 2018 lows, the asset has essentially moved in line with the broader crypto market. Potential roadmaps for upcoming price movements can be found on high timeframes using Exponential Moving Averages, volume profiles, Pitchforks, chart patterns, and the Ichimoku Cloud. Further background information on the technical analysis discussed below can be found here.
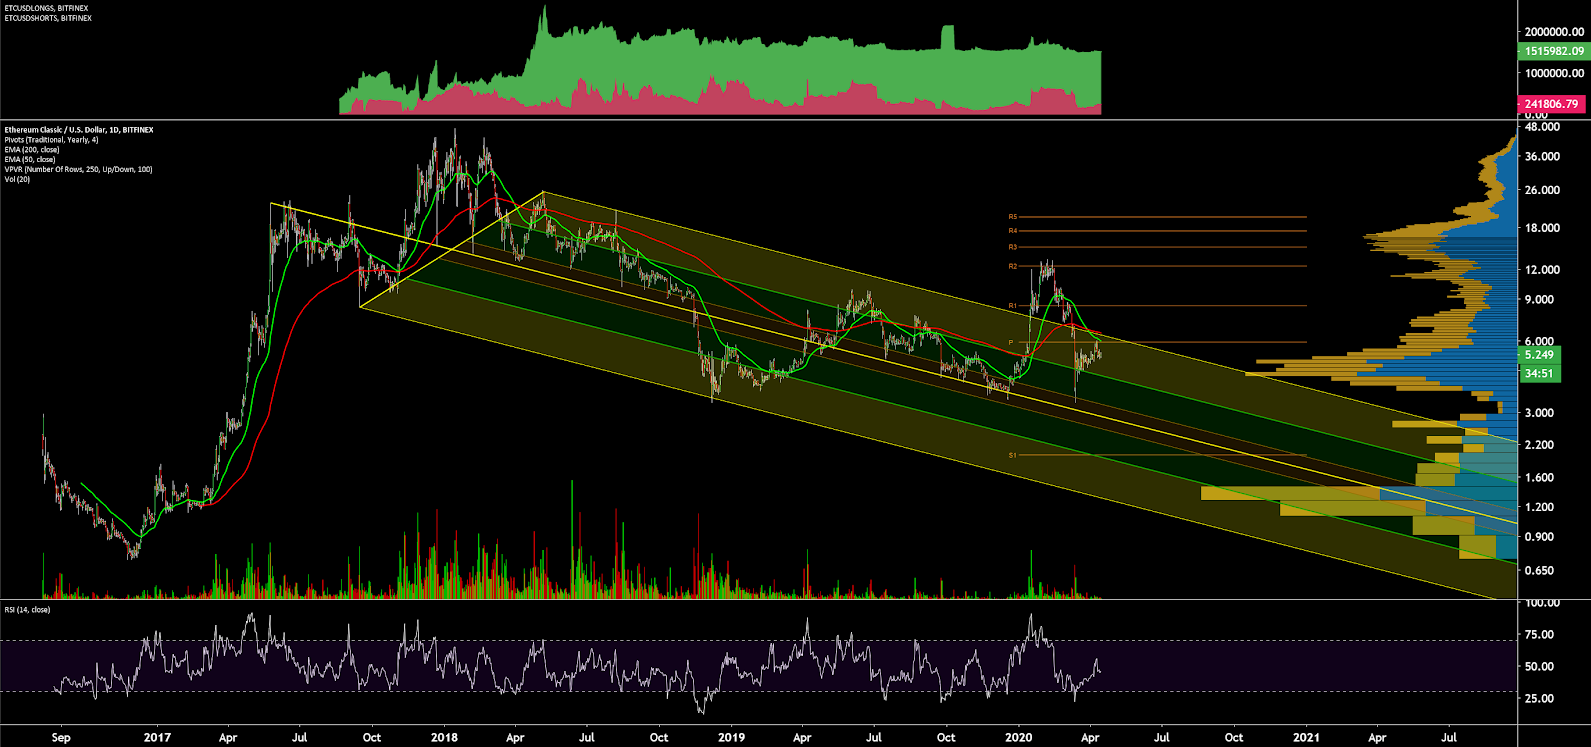
On the daily chart for the ETC/USD market, the 50-day Exponential Moving Average (EMA) and 200-day EMA Golden Cross on January 20th was quickly followed by a bearish Death Cross on March 27th. The 50-day and 200-day EMAs at US$5.98 and US$6.55 may now act as resistance. Significant volume support on VPVR (horizontal bars) sits between US$4.20 and US$4.90. Yearly Pivots, or mathematical support and resistance based on the highs and lows of the previous year, also sit at US$2.00 and US$6.00.
The long/short open interest on Bitfinex (top panel, chart below) since April 2018 has been heavily net long, with long positions currently accounting for 86% of open interest. A significant price movement downwards will result in an exaggerated move further, as the long positions will begin to unwind. This is known as a “long squeeze.” Additionally, there are no active bullish or bearish divergences on RSI or volume at this time.
The spot price has also re-entered the multi-year bearish Pitchfork (PF) with anchor points in May and September 2017, and May 2018. This market broke out from a falling wedge in November 2018, to the downside, breaching the PF median line (yellow) with significant bearish momentum. Price has now re-tested the median line several times, confirming a support level.
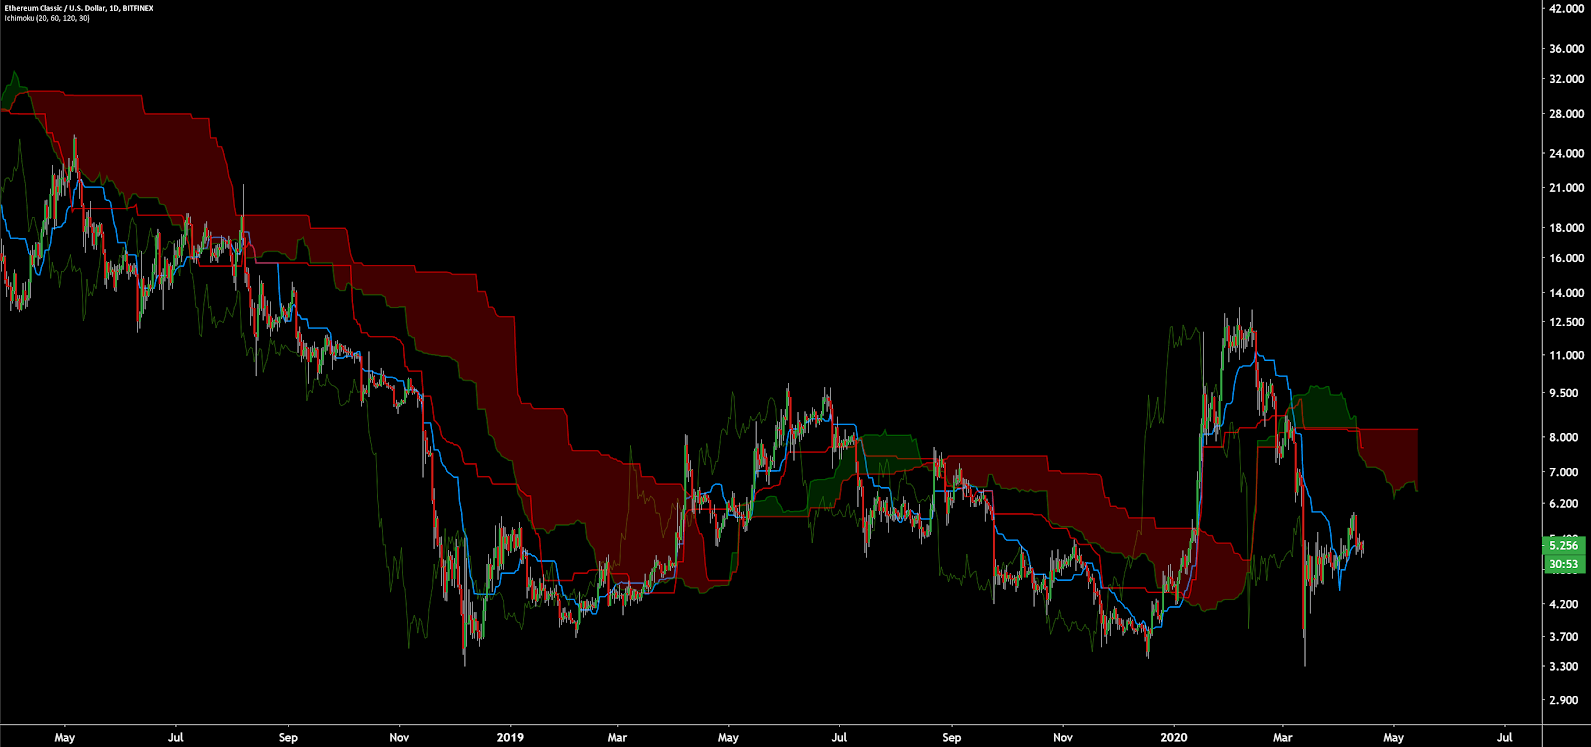
Turning to the Ichimoku Cloud, four metrics are used to indicate if a trend exists; the current price in relation to the Cloud, the color of the Cloud (red for bearish, green for bullish), the Tenkan (T) and Kijun (K) cross, and the Lagging Span. The best entry always occurs when most of the signals flip from bearish to bullish, or vice versa.
Cloud metrics on the daily time frame with doubled settings (20/60/120/30), for more accurate signals, are bearish; the spot price is below the Cloud, the Cloud is bearish, the TK cross is bearish, and the Lagging Span is below the Cloud and near the current spot price. The trend will remain bearish so long as the spot price remains below the Cloud. A long flat Kumo at US$8.26 should act as a magnet for price.
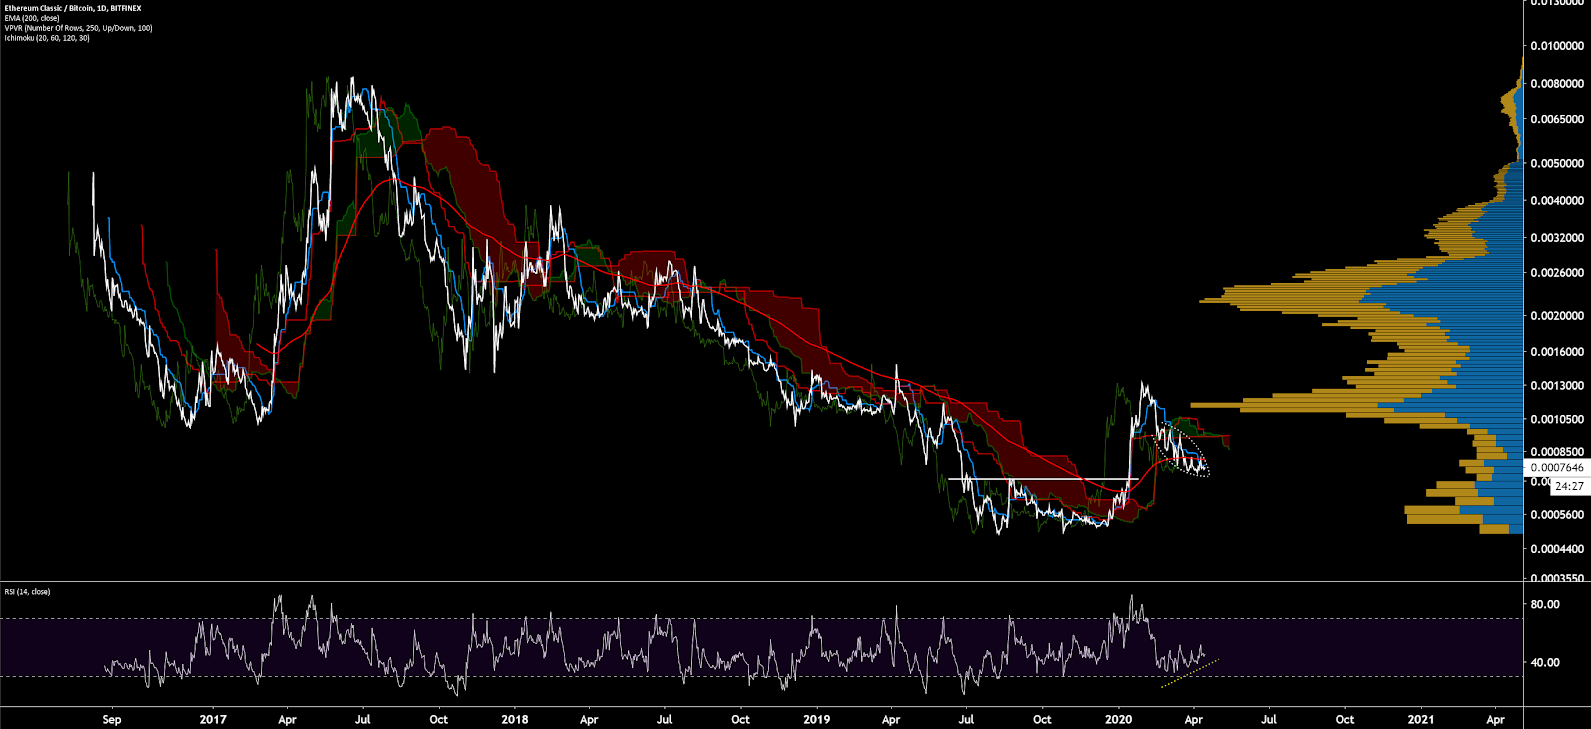
Lastly, on the daily ETC/BTC chart, trend indicators also suggest a bearish trend. The spot price is below the 200-day EMA and the daily cloud. Again, a long entry will not trigger until the spot price is above the Cloud and the 200-day EMA. Based on VPVR, upside resistance remains at 11,500 sats and 22,000 sats and downside support sits at 5,200 to 7,000 sats. Open interest on Bitfinex is currently 88% short (not shown) and there is an active bullish divergence on RSI, suggesting waning bearish momentum.
Conclusion
Ethereum Classic (ETC) continues to have previous Ethereum (ETH) developments added to its main-net, after implementing Atlantis in April 2019, and Agartha in January 2020. The next protocol upgrade, _Phoenix_, is set to be implemented in June this year.
ETC’s value-add appears to be a hard cap on the total number of coins, and no plans to switch from PoW to PoS. ETC can also act as a hedge against a failed ETH PoS transition. ETC’s block reward was recently reduced by 20%, but still remains higher than ETH’s. ETC may also rise to prominence in the mining world after the ETH consensus algorithm change to ProgPoW, as ASIC miners will look to turn a profit. There is also a pending ETC proposal to change the consensus algorithm in an attempt to increase ASIC resistance.
Technicals for both the ETC/USD and ETC/BTC pairs suggest a bearish trend. Until spot prices are once again above both the 200-day EMA and Cloud for both pairs, a bearish trend is more likely than a bullish trend. Downside support for ETC/USD sits at US$5.00 and ETC/BTC sits at 7,000 sats.
ETC/USD upside will likely be limited to the 50% retracement of the range at US$8.26, until further consolidation. ETC/BTC oscillators suggest waning bearish momentum with a short squeeze in the making, potentially fueling a price move back to above 10,000 sats. Speculators opposed to the ETH ProgPoW and Proof of Stake changes may also look to hedge on ETC in the near future.
ETC can be traded on Binance.
OhNoCrypto
via https://www.ohnocrypto.com
Josh Olszewicz, Khareem Sudlow
