Data Snippet - Bitcoin scarcity and Price value proposition
Bitcoin mining requires computing power, which incurs a cost. To recuperate this cost, the miner that verifies each block is rewarded for their work with newly-created bitcoins. This ‘block reward’ is how new bitcoins are released into the system.
The current block reward is 12.5 bitcoins per block. A new block of transactions is added to the Bitcoin blockchain approximately every ten minutes. An average of 144 blocks are mined every day which means approximately 1,800 new bitcoins are produced every 24 hours.
Bitcoin has a pre-programmed supply limit of 21 million bitcoins. To reduce the rate that new bitcoins are produced as the circulating supply approaches this limit, the bitcoin protocol reduces the number of new bitcoins included in each block by half.

CHART FEATURES
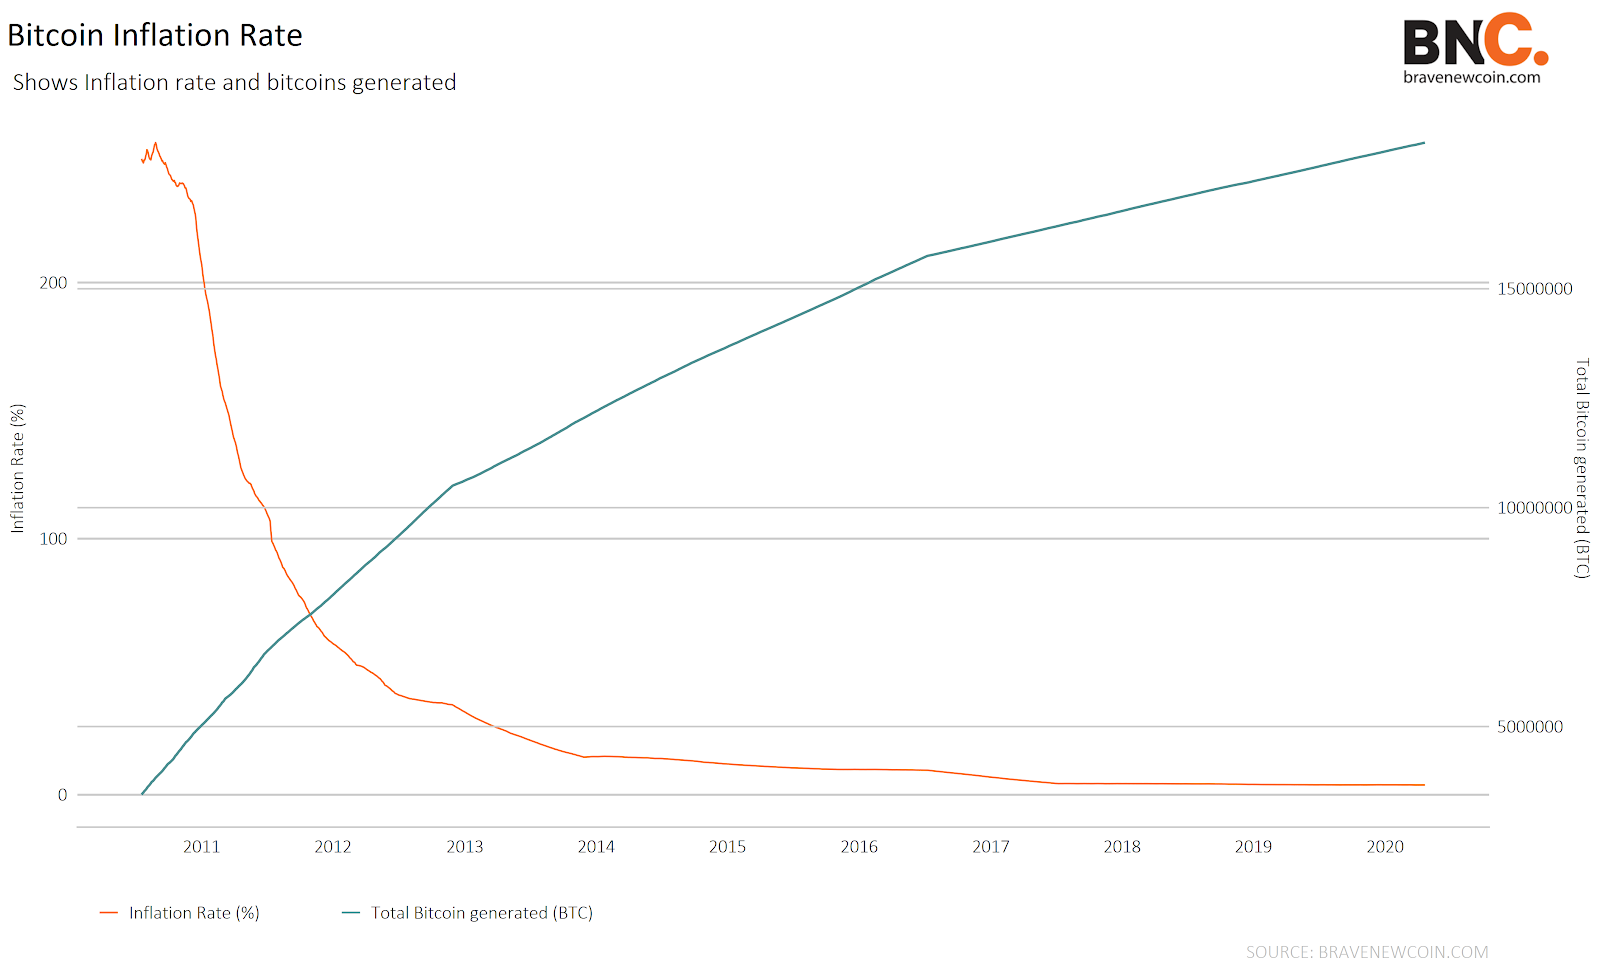
- Inflation Rate: The rate at which the supply changes over a period of time.
- Inflation Rate= (Current day total supply - 365 days before total supply)/ 365 days before total supply
- Total Bitcoins Generated: The cumulative total of block rewards generated by miners.

INSIGHTS BREAKDOWN
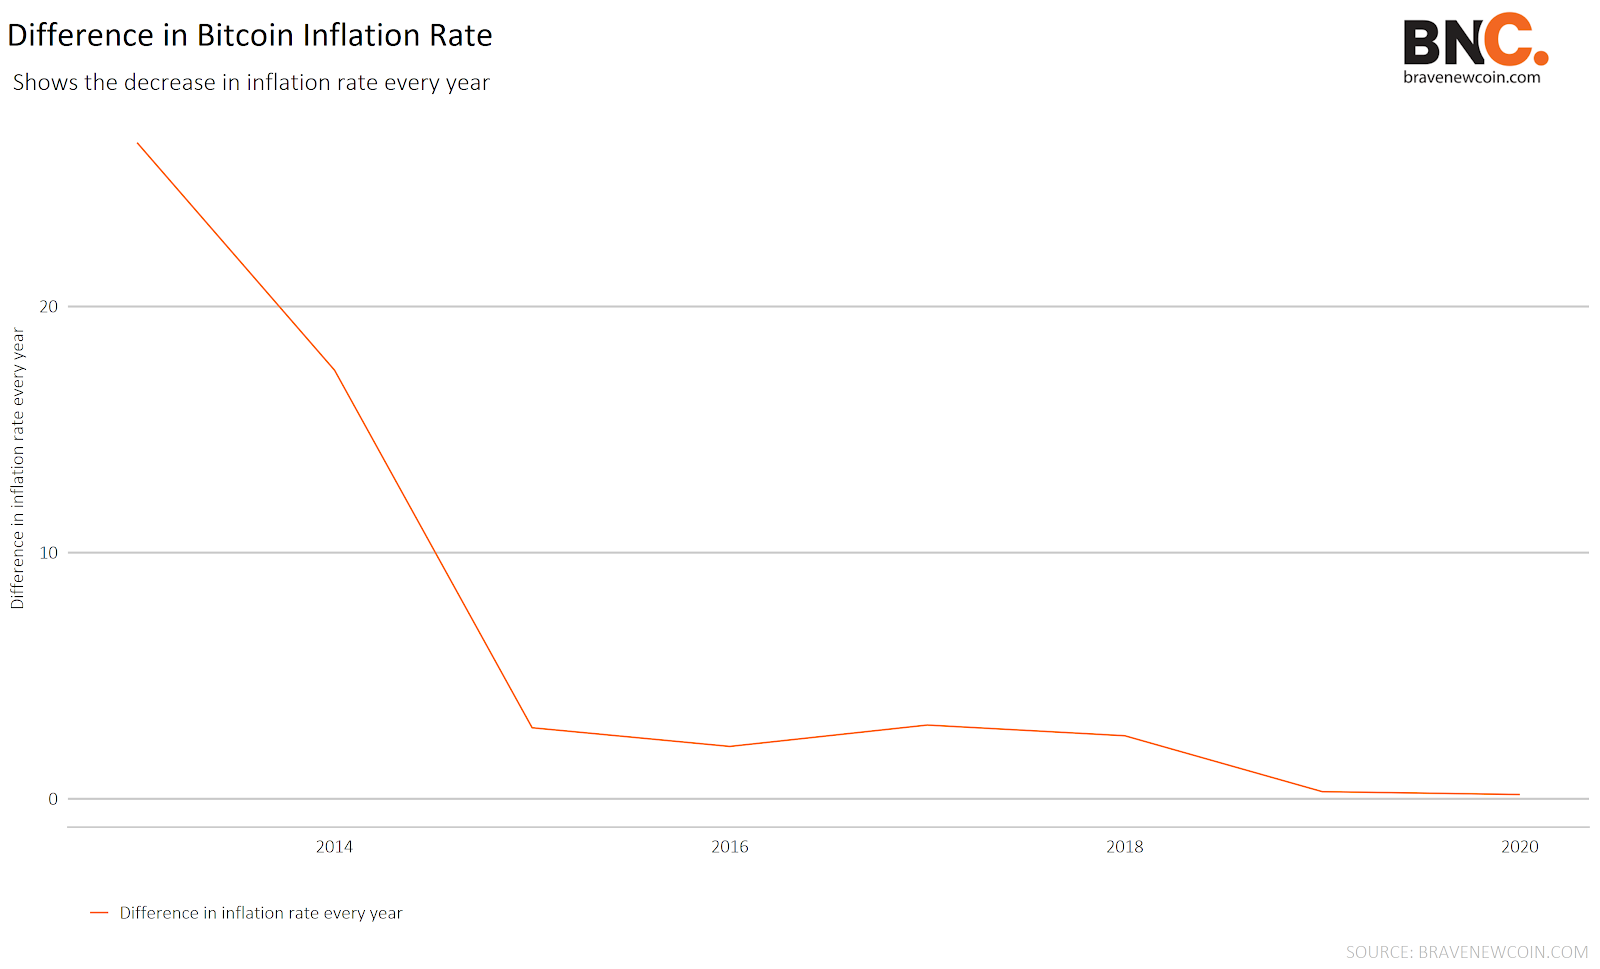
- Since the second block reward halving in 2016, the inflation rate has been decreasing at an average of 1.5% every year. In 2021, we can expect the inflation rate to decrease from 3.8% to 1.8% due to the upcoming third halving. This will play a major role in the future bitcoin price.
- Bitcoin scarcity will keep increasing and it will take around 20 years to produce the last 1 million BTC.
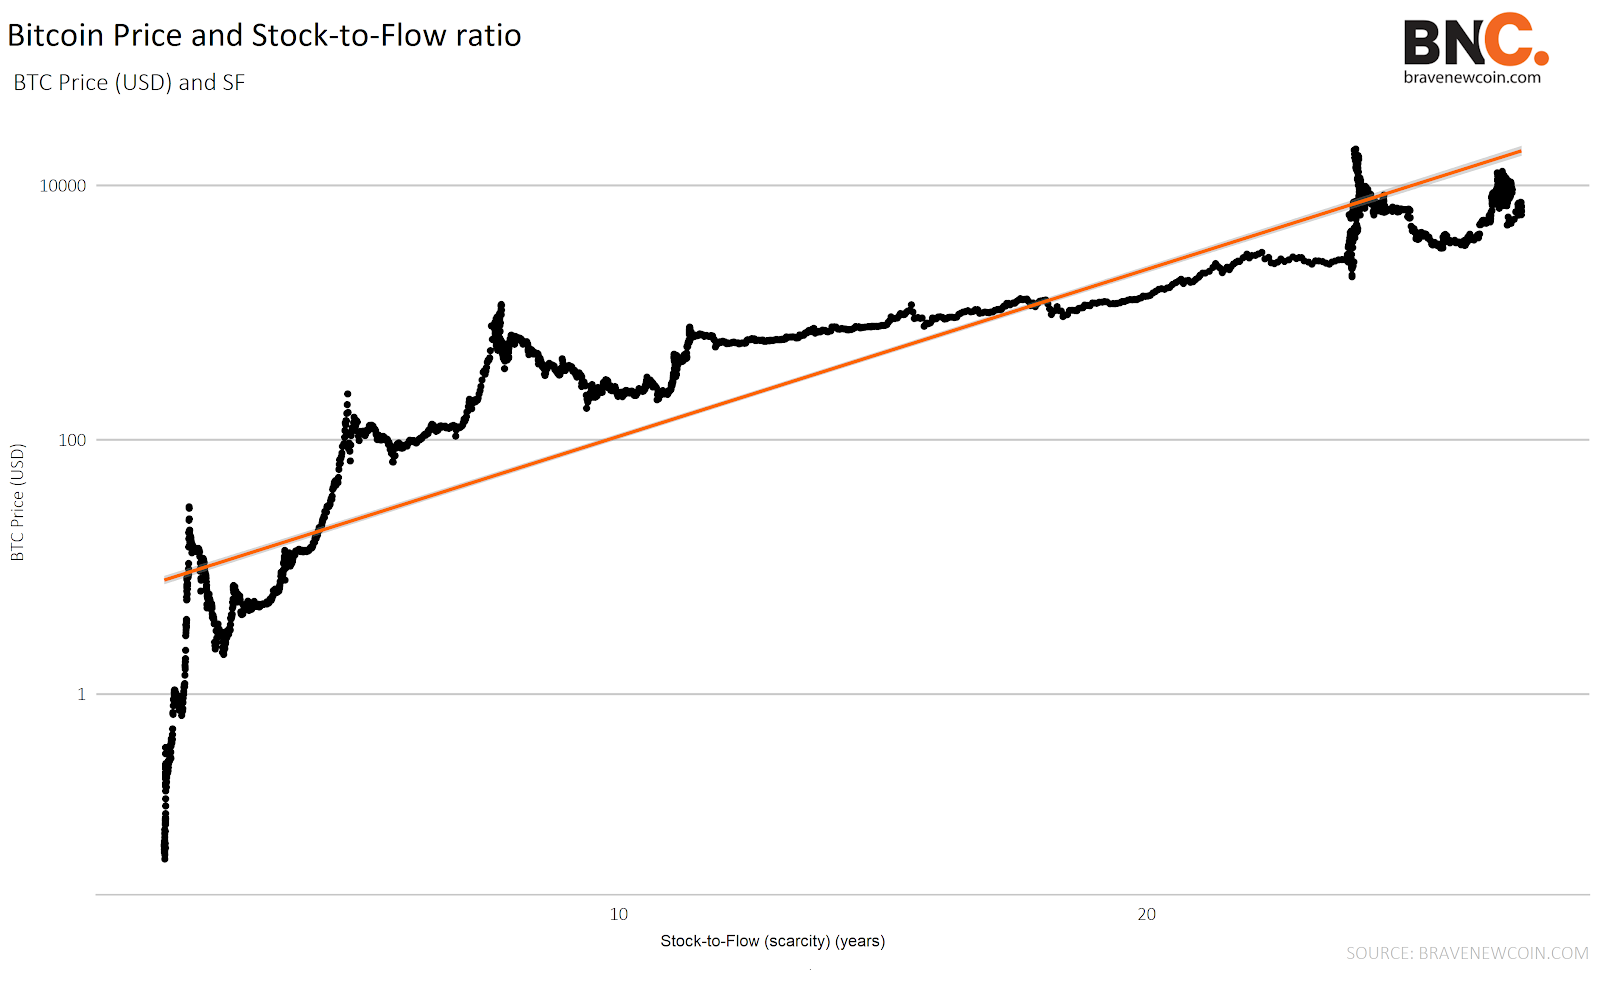
- Bitcoin scarcity can be measured using a Stock-to-flow ratio, which directly drives the value.
DIVING DEEPER INTO THE BITCOIN SCARCITY USING STOCK-TO-FLOW
Stock-to-Flow takes the size of the existing stockpiles or reserves (stock) and the yearly production (flow). The current Gold Stock-to-Flow is 62. Starting with no stock, it would take 62 years of production to get to the current gold stock level.

The above graph details the relationship between bitcoin scarcity and the BTC/USD market spot price value.
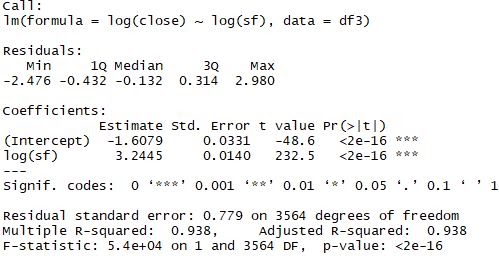
Fitting the ordinary least squares regression with a log-log model over the past 10 years of data, with a log of price value as the dependent variable. The level of significance (p-value) and the coefficients explains the relationship is statistically significant. The strength of the relationship is explained using R-squared.
OLS Regression summary:
TAKE-AWAYS:
- The statistical significance explains the very strong elasticity relationship between Bitcoin scarcity over time and the price value, with a 93.8% variation in the log of price around its mean.
- R-squared is not 100% accurate, as there are other significant factors, other than scarcity, which impact the price.
- Demand has increased not only due to the scarcity increase, but also a range of fundamental changes, including the estimated transaction volume increase on the blockchain.
- As we can see from the summary, both price and Stock-to-Flow are log-transformed, we consider the proportional interpretation. Mathematically, for every 1% increase in the number of years to produce the current existing stock, price increases by 3.2445%.
Bitcoin’s historical data gives us some insights into potential future price projections. But other factors outside of scarcity also affect the price, such as an increase in the supply, buying demand, miners, computational power, transactional volumes, active addresses. Every bull market yields different gains and every bear market varies in its downward trend.
OhNoCrypto
via https://www.ohnocrypto.com
Sumathi Pandi, Khareem Sudlow

