Ethereum Rebounds, Resumes Sideways Move above $210
#OhNoCrypto

Ethereum has continued its running battle to defend the $200 support level. In the last downtrend, the bears sank Ether to a $197 low.
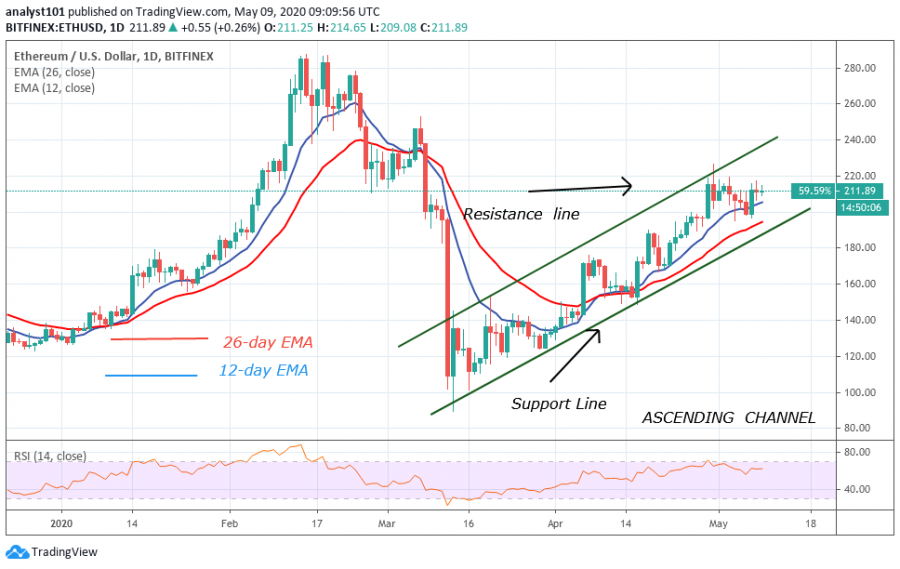
On May 7, the bulls rebounded twice at $197 low and reached a high of $216. The bears’ pulled price back as the market fluctuates above $210. The upward move is hampered as bulls break the first resistance.
Ether has two more hurdles to jump over; the hurdle at $220 and $227 resistances. The market is currently consolidating above $210 support. Possibly, a rebound above $210 is likely to break through the resistances of $220 and $227. The momentum may extend to $240 and $250 price level. Conversely, if the bulls failed to sustain above $210, the downtrend will resume.

Key Resistance Zones: $220, $240, $260
Key Support Zones: $160, $140, $120
Disclaimer. This analysis and forecast are the personal opinions of the author that are not a recommendation to buy or sell cryptocurrency and should not be viewed as an endorsement by CoinIdol. Readers should do their own research before investing funds.
OhNoCryptocurrency via https://www.ohnocrypto.com/ @coinidol.com By Coin Idol, @Khareem Sudlow
May 09, 2020 at 10:58 //
News
News

Ethereum has continued its running battle to defend the $200 support level. In the last downtrend, the bears sank Ether to a $197 low.
On May 7, the bulls rebounded twice at $197 low and reached a high of $216. The bears’ pulled price back as the market fluctuates above $210. The upward move is hampered as bulls break the first resistance.
Ether has two more hurdles to jump over; the hurdle at $220 and $227 resistances. The market is currently consolidating above $210 support. Possibly, a rebound above $210 is likely to break through the resistances of $220 and $227. The momentum may extend to $240 and $250 price level. Conversely, if the bulls failed to sustain above $210, the downtrend will resume.
Ethereum indicator analysis
The crypto is at level 62 of the Relative Strength Index. It indicates that the coin is in the uptrend zone and may likely to rise. It is above the centerline 50. The EMAs are sloping upward while 12-day EMA is a support for the coin.
Key Resistance Zones: $220, $240, $260
Key Support Zones: $160, $140, $120
What is the next direction for Ethereum?
From the daily chart, price is above the EMAs which indicates a further upward move. The uptrend is likely as long as the price is above the EMAs. The bulls have made an initial retest to break the resistance line. If price breaks the resistance line and closes above it, the uptrend will resume.Disclaimer. This analysis and forecast are the personal opinions of the author that are not a recommendation to buy or sell cryptocurrency and should not be viewed as an endorsement by CoinIdol. Readers should do their own research before investing funds.
OhNoCryptocurrency via https://www.ohnocrypto.com/ @coinidol.com By Coin Idol, @Khareem Sudlow
