Ethereum Could Dive Below $225 Unless It Surges Past $235
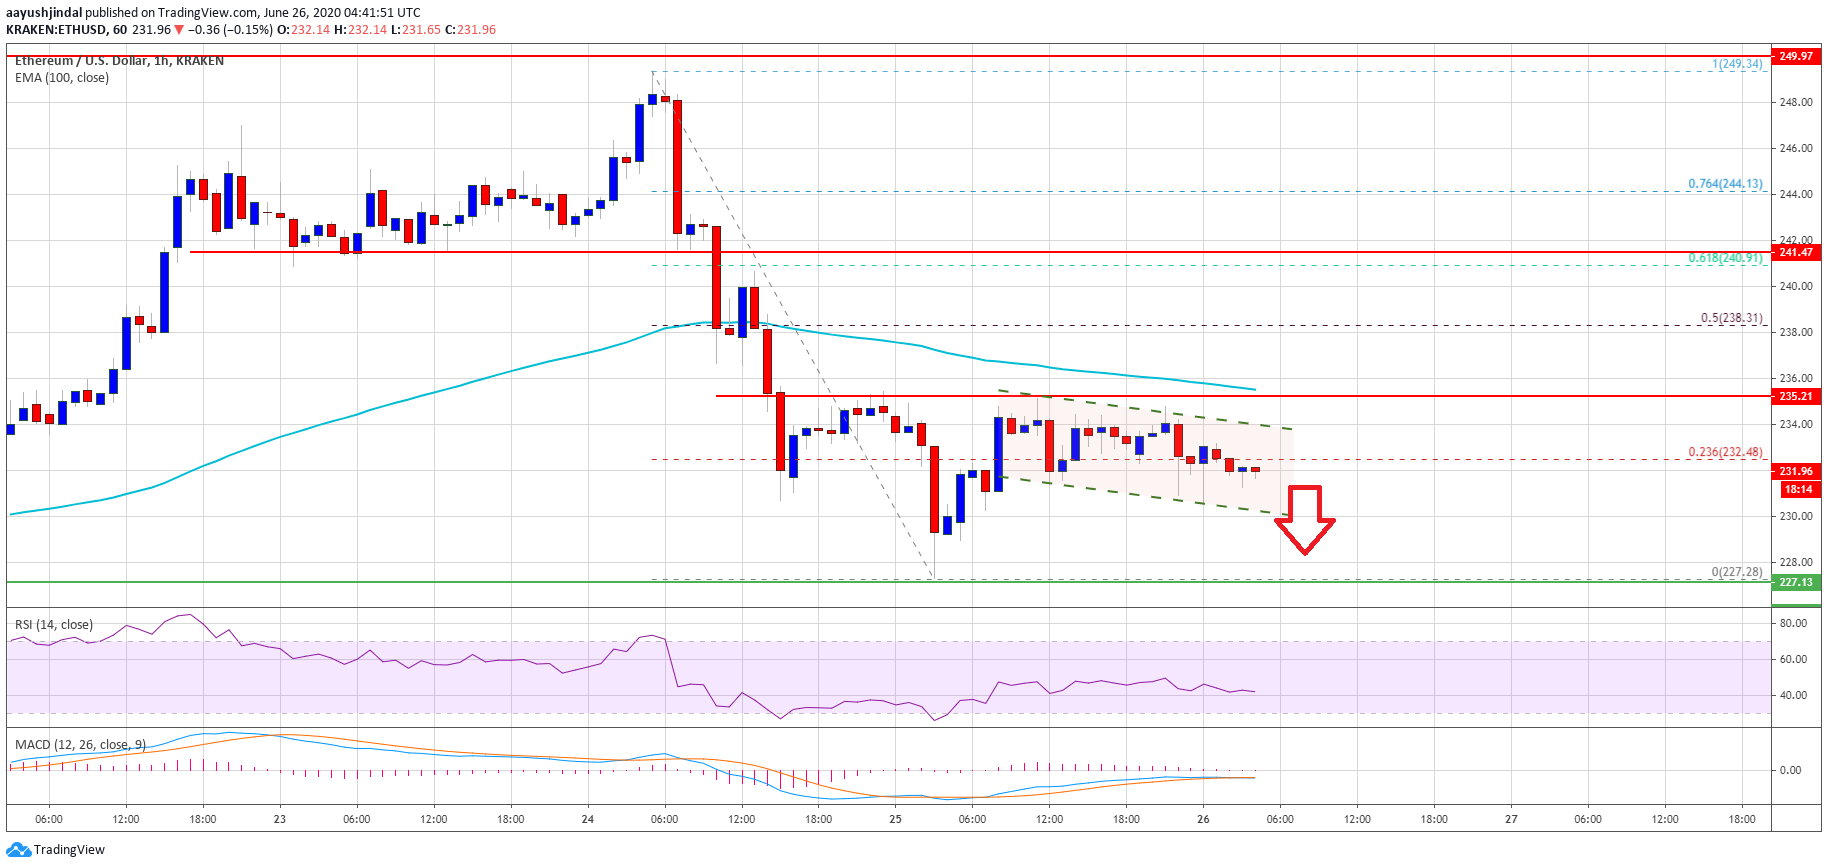
Ethereum is currently correcting losses from the $228 low against the US Dollar. ETH must climb above the $235 resistance to start a fresh increase in the near term.
- Ethereum is facing a couple of important hurdles near $235 and the 100 hourly simple moving average.
- The current price action suggests high chances of more losses below $230.
- There is a short-term declining channel forming with support near $230 on the hourly chart of ETH/USD (data feed via Kraken).
- The pair could decline heavily below $225 unless it surges past the $235 resistance zone.
Ethereum Price Might Resume Decline
After a strong decline below $235, Ethereum found support near the $228 level against the US Dollar. ETH price started an upside correction above the $230 level, but it is well below the 100 hourly simple moving average.
There was a break above the $232 level, plus the 23.6% Fib retracement level of the downward move from the $250 high to $228 low. However, the price is struggling to clear the $235 resistance (a multi-touch zone).
Ethereum price testing $230. Source: TradingView.com
The 100 hourly SMA is also near the $235 level to act as a resistance. It seems like there is a short-term declining channel forming with support near $230 on the hourly chart of ETH/USD. If the pair fails to stay above the channel support at $230, it could resume its decline.
The next support is near the $228 level, below which ether price might test the $225 support. Any further losses may perhaps spark a sharp decline below the $220 level in the near term.
Here Are Chances of Upside Break in ETH
The first major hurdle for Ethereum is near the $235 level. If there is an upside break above $235, the price could test the 50% Fib retracement level of the downward move from the $250 high to $228 low at $238.
If the bulls gain traction above the $235 and $238 resistance levels, ether might continue to rise. The next resistance is at $240, above which the price is likely to retest the $250 barrier.
Technical Indicators
Hourly MACD – The MACD for ETH/USD is moving back into the bearish zone.
Hourly RSI – The RSI for ETH/USD is now well below the 40 level, with a bearish angle.
Major Support Level – $225
Major Resistance Level – $235
Take advantage of the trading opportunities with Plus500
Risk disclaimer: 76.4% of retail CFD accounts lose money.
OhNoCrypto
via https://www.ohnocrypto.com
Aayush Jindal, Khareem Sudlow


