Ethereum Eyeing Last Line of Defense: Here Are Key Supports To Watch
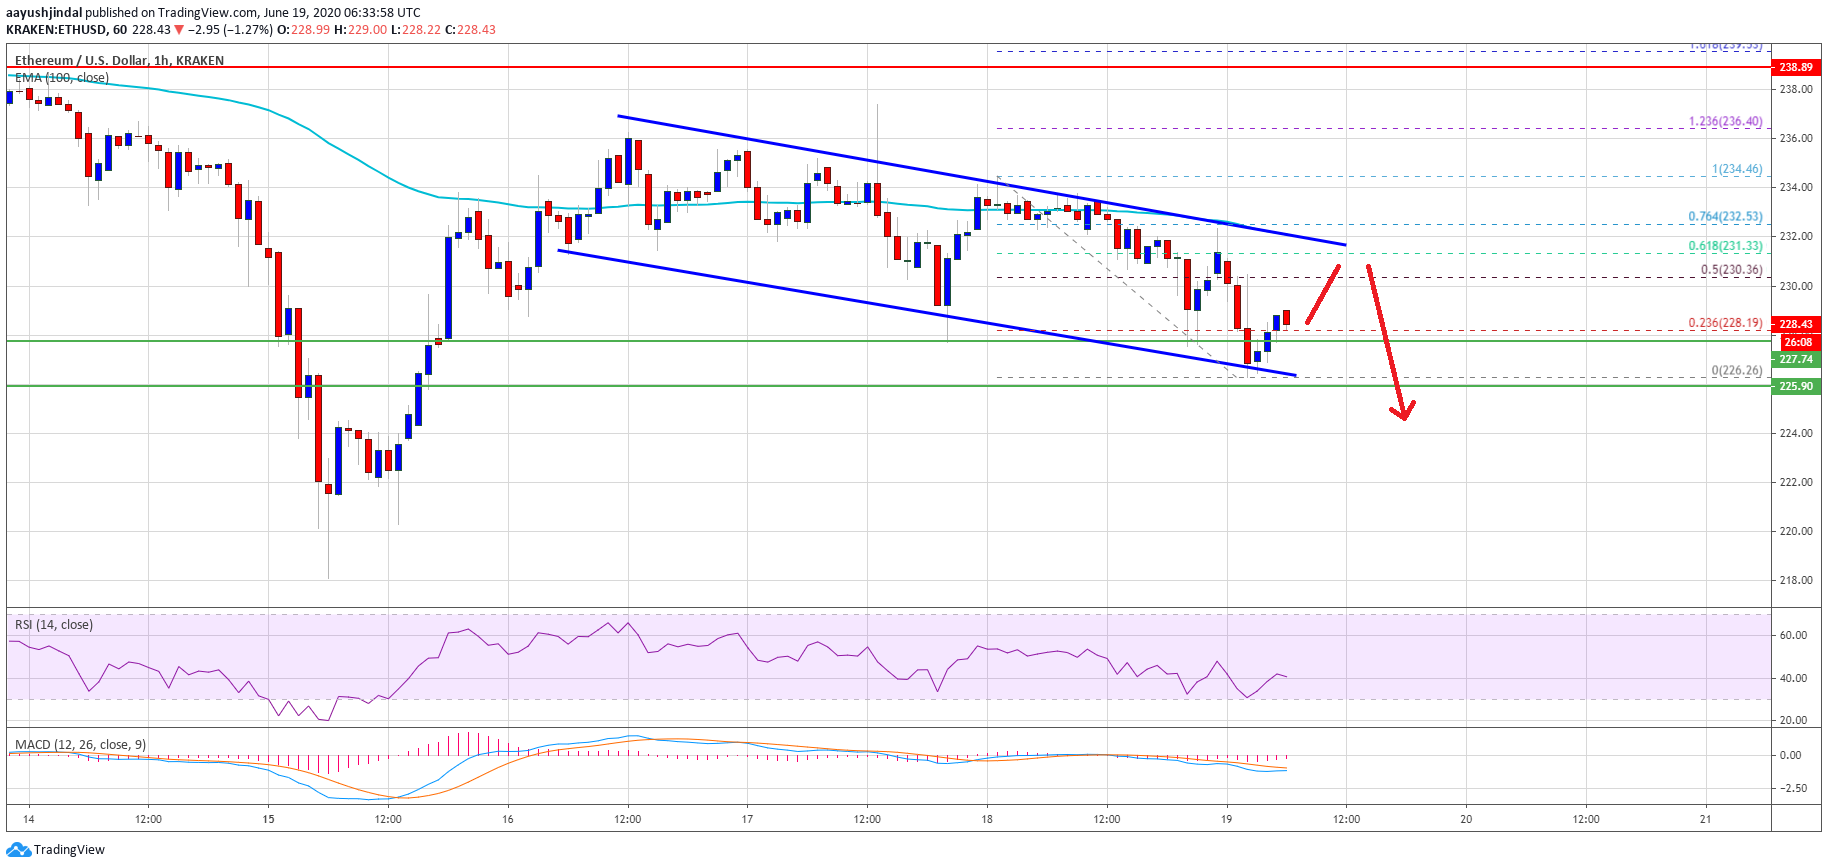
Ethereum is declining steadily below the $235 resistance zone against the US Dollar. It seems like ETH could decline heavily if it breaks the $225 support zone in the near term.
- Ethereum is trading in a bearish zone below $232 and the 100 hourly simple moving average.
- The price is slowly declining towards the key $225 support zone.
- Yesterday’s followed major declining channel is still active with resistance near $232 on the hourly chart of ETH/USD (data feed via Kraken).
- The pair could decline sharply if it fails to stay above the main $225 support zone.
Ethereum Price Declining Steadily
In the past two days, Ethereum price followed a bearish path from the $238-$240 resistance against the US Dollar. ETH broke many supports such as $235 and $232 to move into a short-term bearish zone.
It even settled below the $232 level and the 100 hourly simple moving average. Ether traded close to the $225 support zone and formed a new intraday low at $226. It is currently correcting higher and trading above $228.
An initial resistance on the upside is near the $230 level. It is close to the 50% Fib retracement level of the recent decline from the $235 swing high to $226 low. More importantly, yesterday’s followed major declining channel is still active with resistance near $232 on the hourly chart of ETH/USD.
Ethereum price trades below $230. Source: TradingView.com
The channel resistance is near the 61.8% Fib retracement level of the recent decline from the $235 swing high to $226 low. Therefore, the price is likely to face a strong selling interest near the $232 level and the 100 hourly simple moving average.
On the downside, the main support is seen near the $225 level. If the price fails to stay above the $225 support, there is a risk of a larger decline towards the $218 and $215 levels in the near term.
Chances of an Upside Break in ETH?
To move into a positive zone, Ethereum must break the channel resistance, $232, and the 100 hourly SMA. The next key resistance is near the $238 and $240 levels.
If ether price settles above the $240 resistance zone, it could start a strong increase. The next set of resistances might be near the $250 and $255 levels.
Technical Indicators
Hourly MACD – The MACD for ETH/USD is about to move into the bullish zone.
Hourly RSI – The RSI for ETH/USD is now just above the 40 level, with bearish signs.
Major Support Level – $225
Major Resistance Level – $232
Take advantage of the trading opportunities with Plus500
Risk disclaimer: 76.4% of retail CFD accounts lose money.
OhNoCrypto
via https://www.ohnocrypto.com
Aayush Jindal, Khareem Sudlow

