Ethereum Signaling Bullish Breakout: A Strong Case For Upside Above 100 SMA
Ethereum is recovering from the $225 support against the US Dollar. ETH price is now trading near the $230 level ad it seems like there are chances of more gains if it breaks the 100 SMA (H4).
- ETH price is slowly gathering pace from the key $225 support area against the US Dollar.
- It is now approaching the key $235 resistance and the 100 simple moving average (4-hours).
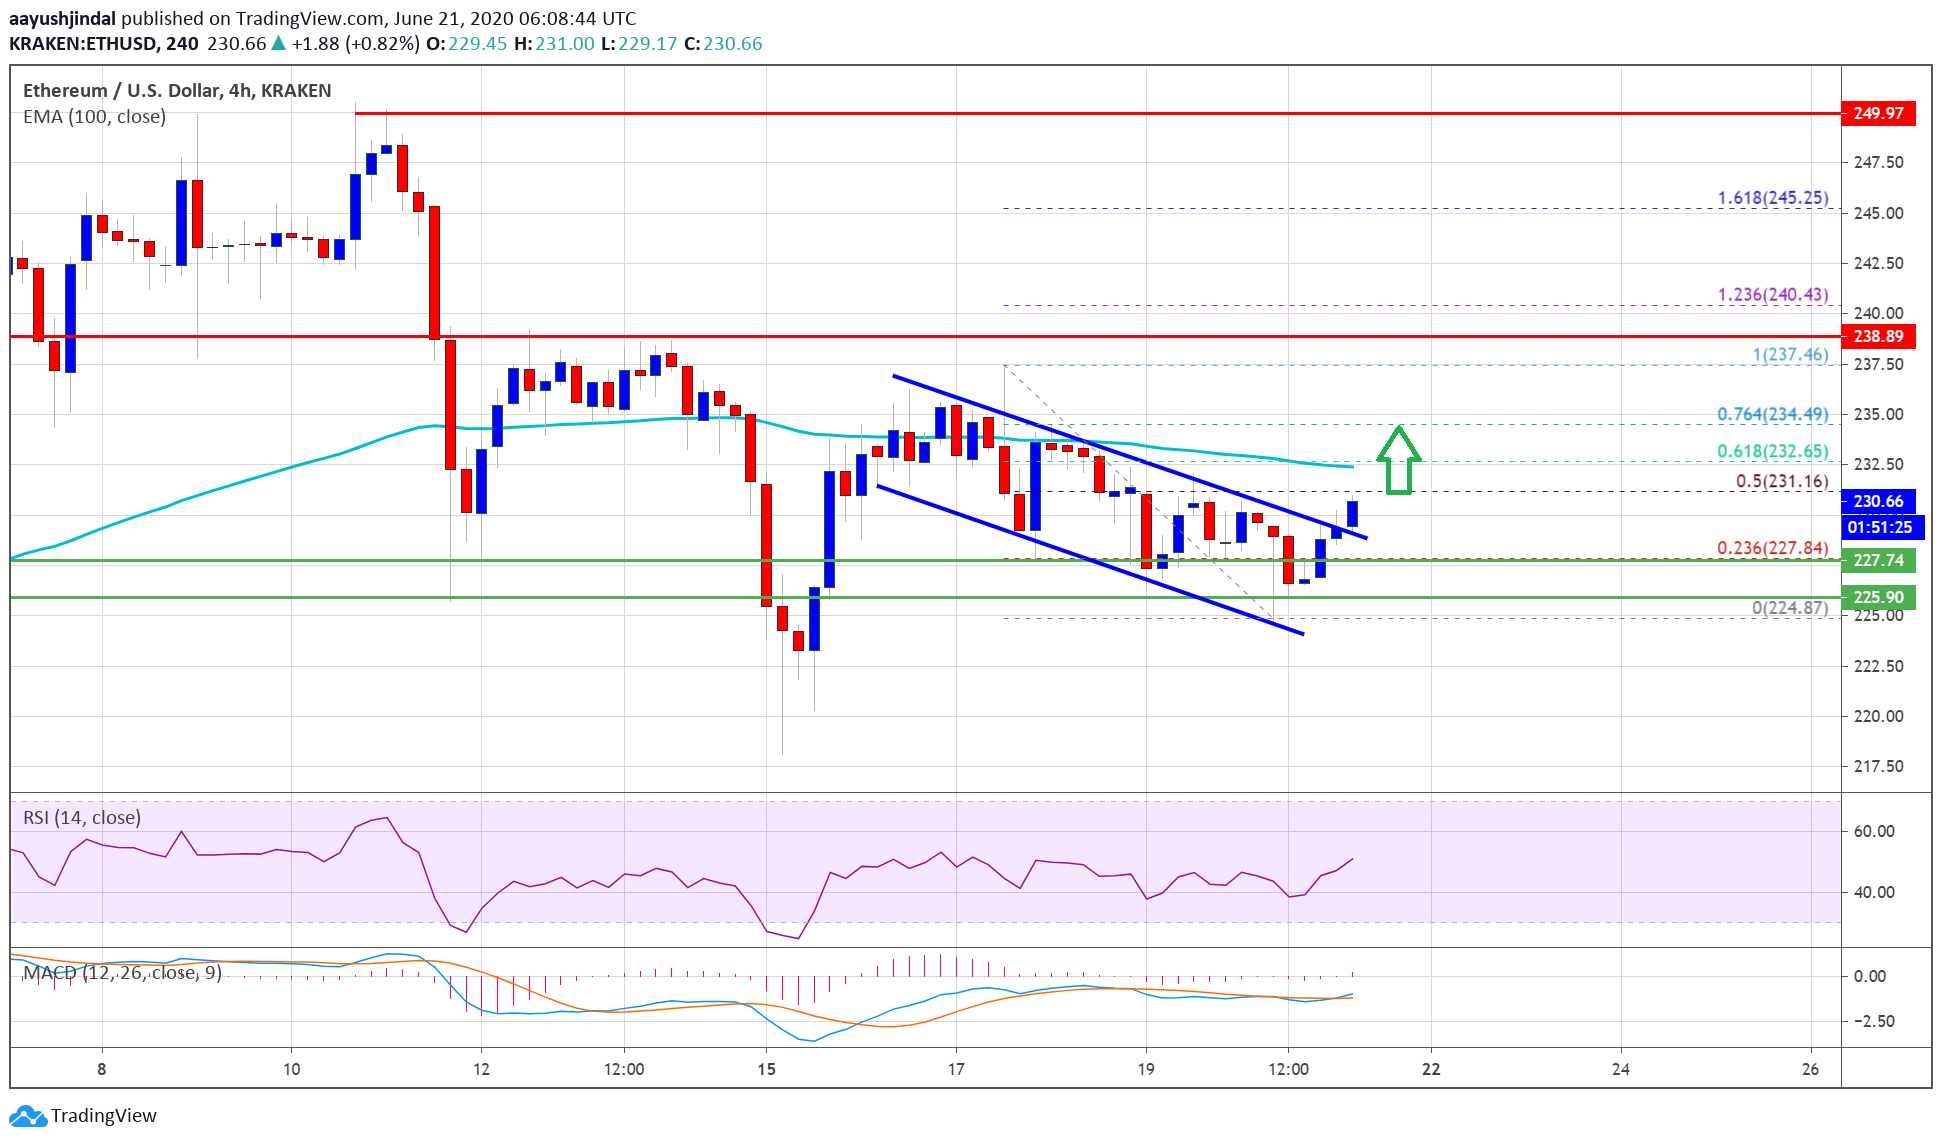
- There was a break above a major declining channel or a bullish flag with resistance near $228 on the 4-hours chart of ETH/USD (data feed via Kraken).
- The pair could start a strong increase if it closes above $232 and the 100 simple moving average (H4).
Ethereum Price Could Struggle Near 100 SMA
This past week, Ethereum grinded lower after it failed to clear the $235 resistance against the US Dollar. ETH price broke the $230 support level and settled well below the 100 simple moving average (4-hours).
However, the $225 support zone acted as a strong buy zone. A low is formed near $224 and the price started a steady increase. There was a break above the $228 resistance, plus the 23.6% Fib retracement level of the downward move from the $237 high to $224 low.
There was also a break above a major declining channel or a bullish flag with resistance near $228 on the 4-hours chart of ETH/USD. It has opened the doors for more gains above the $230 level.
Ethereum price trades below $230. Source: TradingView.com
Ether price is currently showing a lot of positive signs and it might continue to rise towards the $232 resistance and the 100 simple moving average (4-hours). The 50% Fib retracement level of the downward move from the $237 high to $224 low might also act as a resistance.
The main resistance is still near the $235 level. A successful close above the $235 resistance could lead the price further higher. The next major resistance is seen near the $240 level, above which it could test $250.
Fresh Drop in ETH?
On the downside, there are many important supports forming near the $228 and $225 levels. If Ethereum fails to clear the 100 SMA, there are chances of a fresh drop below $228.
A downside break below the $225 support zone could accelerate decline in ether. Any further losses might open the doors for a push towards $218 or even $205.
Technical Indicators
4 hours MACD – The MACD for ETH/USD is slowly gaining in the bullish zone.
4 hours RSI – The RSI for ETH/USD is currently just above the 50 level.
Major Support Level – $225
Major Resistance Level – $235
Take advantage of the trading opportunities with Plus500
Risk disclaimer: 76.4% of retail CFD accounts lose money.
OhNoCrypto
via https://www.ohnocrypto.com
Aayush Jindal, Khareem Sudlow

