Do or Die For Bitcoin Bulls: Here’s What Could Trigger A Sharp Decline
Bitcoin is still holding the $9,000 support zone against the US Dollar. BTC is now approaching a crucial juncture and it could either rally above $9,200 or start a sharp decline below $9,000.
- Bitcoin is trading below a couple of important hurdles near $9,200 and $9,220.
- The price seems to be forming a strong support base above the $9,000 support area.
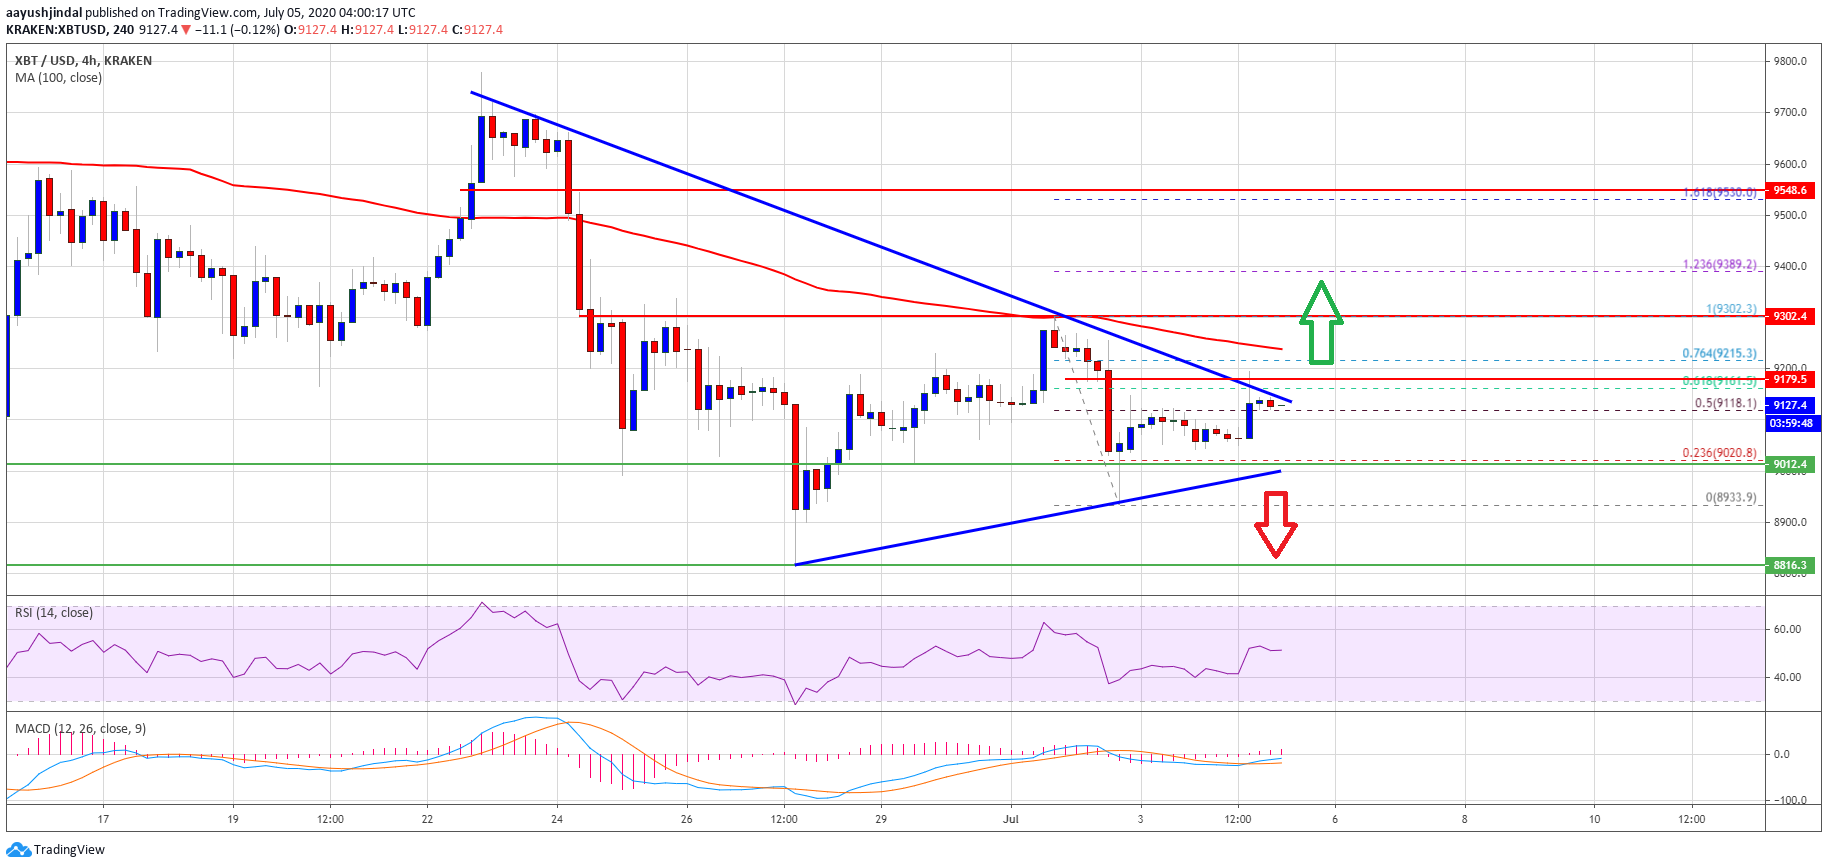
- There is a significant bearish trend line forming with resistance near $9,140 on the 4-hours chart of the BTC/USD pair (data feed from Kraken).
- The pair could start a strong increase if it clears the $9,200 resistance area in the near term.
Bitcoin Approaching Crucial Juncture
This past week, bitcoin made another attempt to gain traction above $9,300 resistance against the US Dollar, but it failed. BTC trimmed gains, and declined below the $9,200 support level and the 100 simple moving average (4-hours).
It even spiked below the $9,000 support level and traded as low as $8,933. Recently, there was a fresh increase above the $9,000 level and it seems like the price is forming a decent support base above the $9,000 level.
There was a break above the 50% Fib retracement level of the downward move from the $9,300 swing high to $8,933 low. Bitcoin price is now facing a major resistance near the $9,150 and $9,200 levels. There is also a significant bearish trend line forming with resistance near $9,140 on the 4-hours chart of the BTC/USD pair.
Bitcoin price holds $9,000: Source: TradingView.com
The trend line is close to the 61.8% Fib retracement level of the downward move from the $9,300 swing high to $8,933 low. Above the trend line, the 100 simple moving average (4-hours) is near the $9,220 resistance.
The main resistance is still near the $9,300 level. Therefore, BTC must surpass the $9,200 and $9,300 resistance levels to start a strong increase in the near term. If the bulls succeed, the price might easily rise towards the $9,500 and $9,600 levels.
Downside Break in BTC?
If bitcoin struggles to clear the $9,200 and $9,300 resistance levels, there is a risk of a sharp decline. The first major support is near the $9,000 level and connecting bullish trend line on the same chart.
A successful bearish break below the $9,000 support could spark a sustained downward move below the $8,800 level in the coming sessions. The next major support is seen near the $8,500 level.
Technical indicators
4 hours MACD – The MACD for BTC/USD is gaining pace in the bullish zone.
4 hours RSI (Relative Strength Index) – The RSI for BTC/USD is currently just above the 50 level.
Major Support Level – $9,000
Major Resistance Level – $9,200
Take advantage of the trading opportunities with Plus500
Risk disclaimer: 76.4% of retail CFD accounts lose money.
OhNoCrypto
via https://www.ohnocrypto.com
Aayush Jindal, Khareem Sudlow

