Ethereum Showing Early Signs of Strong Decline, But $230 Is The Key
Ethereum is retreating lower from the $245 resistance against the US Dollar. ETH is now showing bearish signs below $235, but the $230 support holds the key in the near term.
- Ethereum is currently facing an increase in selling pressure below $240 and $235.
- The price tested the $230 support level and it is currently correcting higher.
- There is a crucial bearish trend line forming with resistance near $235 on the hourly chart of ETH/USD (data feed via Kraken).
- The pair could continue to move down if it fails to recover above $235 and $238.
Ethereum Price Turns Red
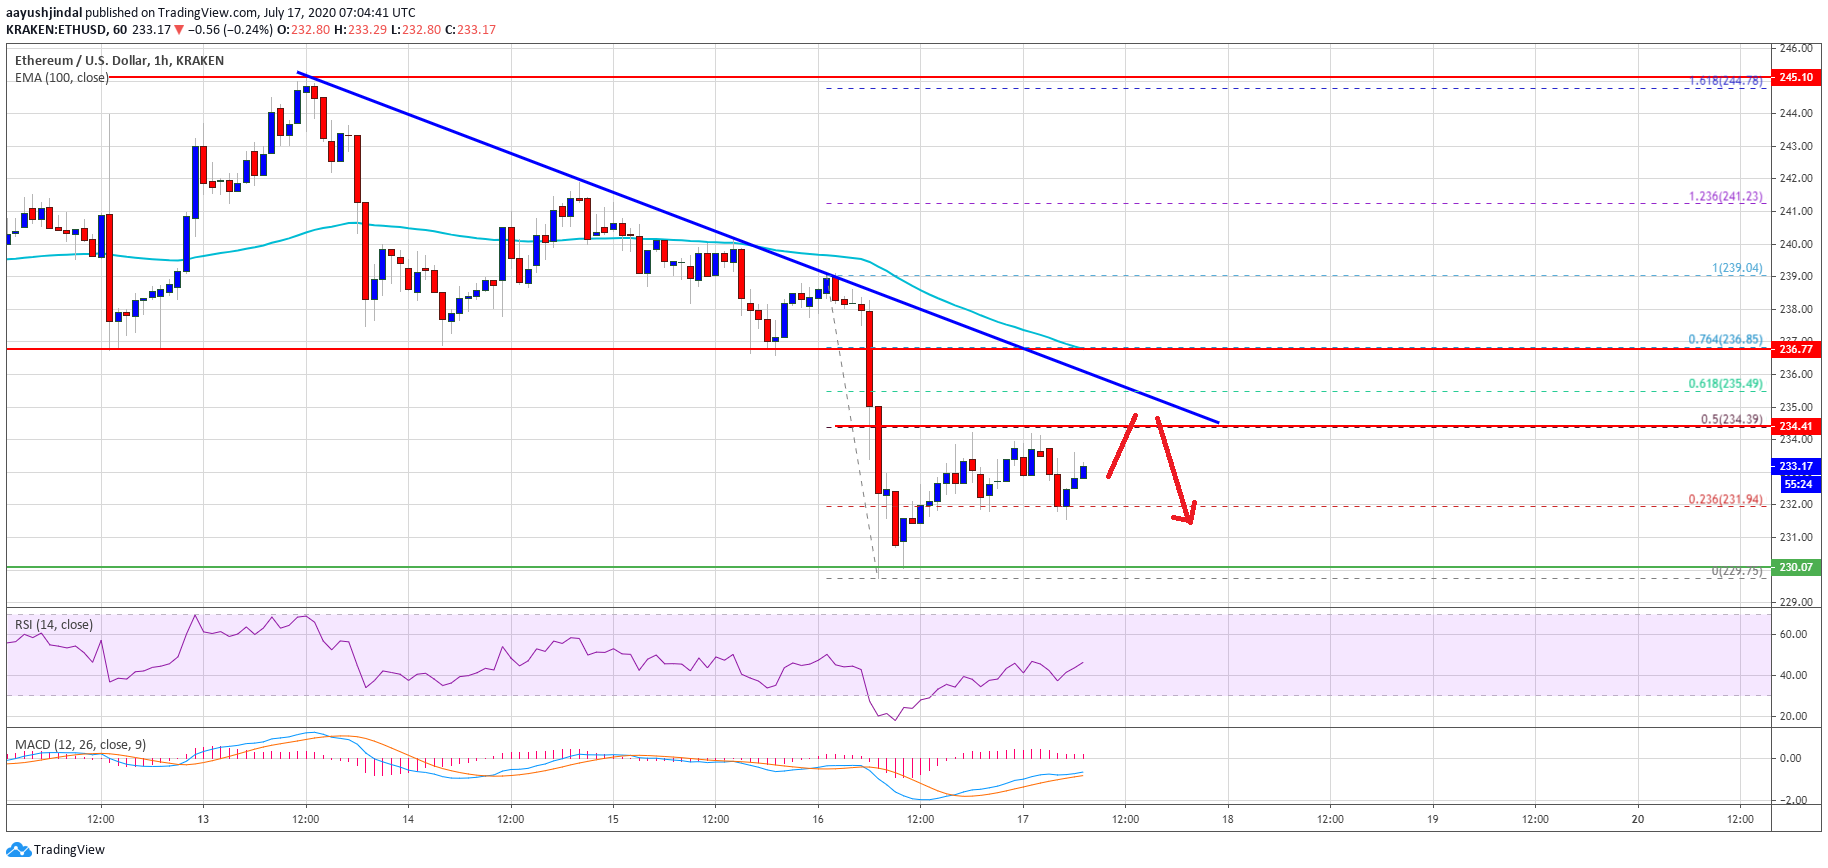
In the past few sessions, Ethereum followed a bearish path from the $245 resistance against the US Dollar. ETH price broke the main $235 support level and the 100 hourly simple moving average to move into a bearish zone.
The decline was such that the price tested the $230 support level. Ether is currently correcting higher and trading above the $232 level. It surpassed the 23.6% Fib retracement level of the recent decline from the $239 swing high to $230 low.
On the upside, the price is facing a strong resistance near the $235 level. There is also a crucial bearish trend line forming with resistance near $235 on the hourly chart of ETH/USD.
Ethereum price trades below $235. Source: TradingView.com
The trend line is close to the 50% % Fib retracement level of the recent decline from the $239 swing high to $230 low. The next key resistance is near the $236 level and the 100 hourly SMA (the recent breakdown zone).
If ether climbs above the $235 and $236 resistance levels, it could start a decent recovery wave. The next hurdle could be $240, but the main barrier for the bulls is still near the $245 level.
More Losses in ETH?
On the downside, the $230 support holds the key in the coming sessions. If there is a successful break and close below the $230 support, it might confirm a bearish break.
In the stated case, the bears are likely to take control and they might aim a test of the $220 pivot level.
Technical Indicators
Hourly MACD – The MACD for ETH/USD is slowly moving in the bullish zone.
Hourly RSI – The RSI for ETH/USD is currently rising towards the 50 level.
Major Support Level – $230
Major Resistance Level – $236
Take advantage of the trading opportunities with Plus500
Risk disclaimer: 76.4% of retail CFD accounts lose money.
OhNoCrypto
via https://www.ohnocrypto.com
Aayush Jindal, Khareem Sudlow

