Bitcoin long-term Price Analysis: 17 August
Bitcoin’s struggle to breach the $12,000-mark is as real as it gets. The level in question has been tapped a few times and even breached once, however, even after these developments, Bitcoin continued to remain under $12,000. This is unlike the rally in April 2019, a time when Bitcoin faced no issues in pushing past this level.
Bitcoin [BTC] Weekly Chart

Source: BTCUSD on TradingView
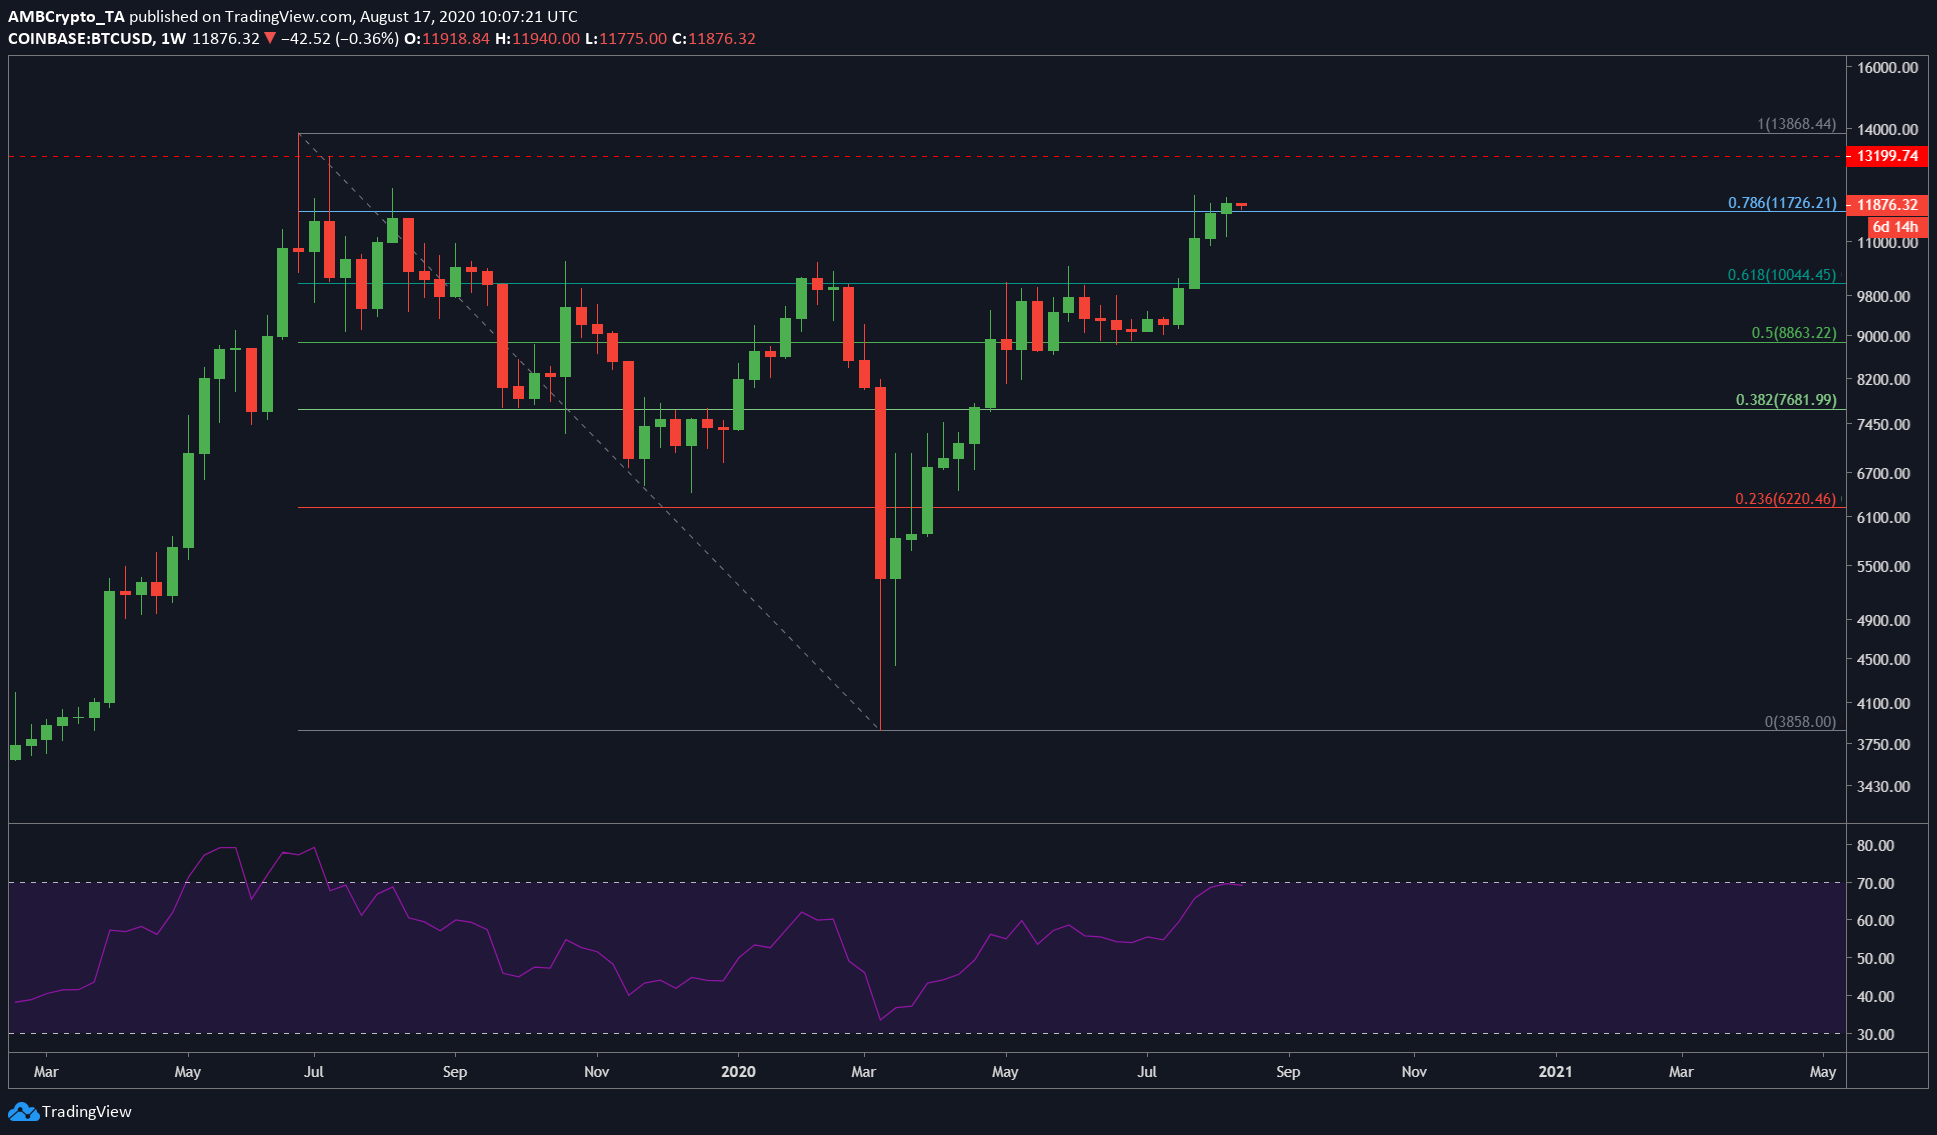
Bitcoin’s weekly chart showed a successful breach of the 0.786 Fibonacci level, a development that came to be after the RSI hit the overbought zone on the charts. The latest weekly candle at press time, much like Ethereum’s weekly chart, had just begun and should close higher than the previous candle to continue the bullishness. Since the RSI was overbought, a brief dip for BTC below the 0.786 level aka $11,726 can be expected soon.
Bitcoin [BTC] 1-Day Chart

Source: BTCUSD on TradingView
Bitcoin’s daily chart showed the formation of a continuation pattern that hinted at another leg up for Bitcoin soon. This breakout could successfully push the price out of $12,000 and into the $13,200 territory. The formation of a bullish pennant showed another 11% surge for Bitcoin, similar to the prior trend before the pennant formation.
The 11% surge will push the price to levels last seen almost a year ago in July when Bitcoin hit $13,202. Hence, considering Bitcoin’s failure to breach this level the last time, it will resist the price from trending higher.
The RSI indicator was just under the overbought zone, however, it was noting a bullish divergence. The price had formed higher lows while the RSI formed higher lows; hence, the divergence was another reason for the price moving from $11,100 on 12 August to the press time price of $11,800 – a 6% surge.
From the RSI and the pennant formation, the chances of Bitcoin pushing higher seem to be a possibility in the near future.
This is an interesting finding as it comes at a time when the CME gap ranging from $9,995 to $9,665 is yet to be filled. While this possibility is present, the chances of the price dropping this low are getting slim.
The post Bitcoin long-term Price Analysis: 17 August appeared first on AMBCrypto.
OhNoCrypto
via https://www.ohnocrypto.com
Akash Girimath, Khareem Sudlow
