Sell Signal Last Formed Prior to March Bitcoin Crash Is Inching Closer
- Bitcoin has been in a strong rally since the March lows.
- The coin moved from $3,500 at those lows to around $12,500 at the local highs.
- Unfortunately for bulls, a crucial sell signal is on the verge of appearing that may mark a medium-term top for Bitcoin.
- The indicator last formed just prior to the March capitulation crash.
Bitcoin Could Soon Undergo Retracement: Trend Indicator Shows
Bitcoin has undergone a strong rally since the March lows. The cryptocurrency more than tripled, rallying from $3,500 to highs of $12,500 in August. The coin now trades at $10,800, slightly below those highs but still far above the March lows.
Unfortunately for bulls, a crucial trend indicator has formed that suggests the rally that Bitcoin has undergone may soon end.
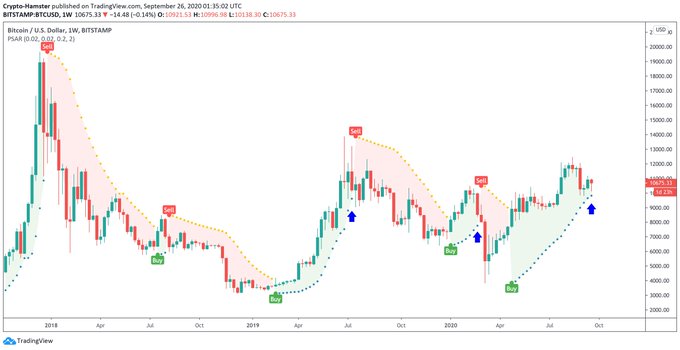
The indicator, the parabolic stop and reversal (parabolic SAR), is about to print a textbook “sell” signal after the strong move higher. Should Bitcoin close its weekly candle $10,000 in the coming weeks, it will print this sell signal.
Previous sell signals have been disastrous for prior Bitcoin bull trends. Just prior to the March capitulation crash, a sell signal appeared. And near the $14,000 highs in 2019, just two weeks after it reached that level, it also formed this sell signal.
Commenting on the indicator, a crypto trader shared the chart seen below and also wrote:
“Weekly Parabolic SAR is approaching to flash the “SELL” signal. It will happen if the price goes below 9800$. Keep in mind that the signal is lagging and the indicator is usually used as a SL level pointer.”
Chart of BTC's price action since the middle of 2017 with a parabolic SAR analysis by crypto analyst CryptoHamster. Chart from TradingView.com
Bulls In Control on a Macro Time Frame
Bulls remain in control on a long-term basis despite the potential medium-term top that is forming as per the indicator.
Crypto Quant, a blockchain analytics firm, recently signaled that 10 out of 11 of its long-term on-chain indicators are currently bullish.
Long-term $BTC on-chain indicators look healthyhttps://t.co/VnrIVP3lDF pic.twitter.com/cfE73acVXh
— CryptoQuant (@cryptoquant_com) September 16, 2020
Featured Image from Shutterstock
Price tags: xbtusd, btcusd, btcusdt
Charts from TradingView.com
Sell Signal Last Formed Prior to March Bitcoin Crash Is Inching Close
OhNoCryptocurrency via https://www.ohnocrypto.com/ @Nick Chong, @Khareem Sudlow

