This Bitcoin Trend Indicator That Last Appeared Prior to $2,500 Rally Returns
- Bitcoin has faced a strong correction in the past 24 hours, dropping to $10,400.
- This comes after the coin hit $11,200 last week in a breakout that some thought would take the coin to $12,000.
- Bitcoin’s weakness comes as legacy markets like the S&P 500 have bled lower due to a number of geopolitical and macro trends.
- Analysts are still optimistic about BTC’s price action despite the recent weakness.
- One fund manager in the space noted that there is clear support in the Bitcoin price, marked by a critical trend indicator.
- The trend indicator recently formed a buy signal.
- This is important as the last time this specific indicator printed such a signal, BTC rallied $2,500 in the span of about a week.
Pivotal Bitcoin Bull Trend Indicator Appears
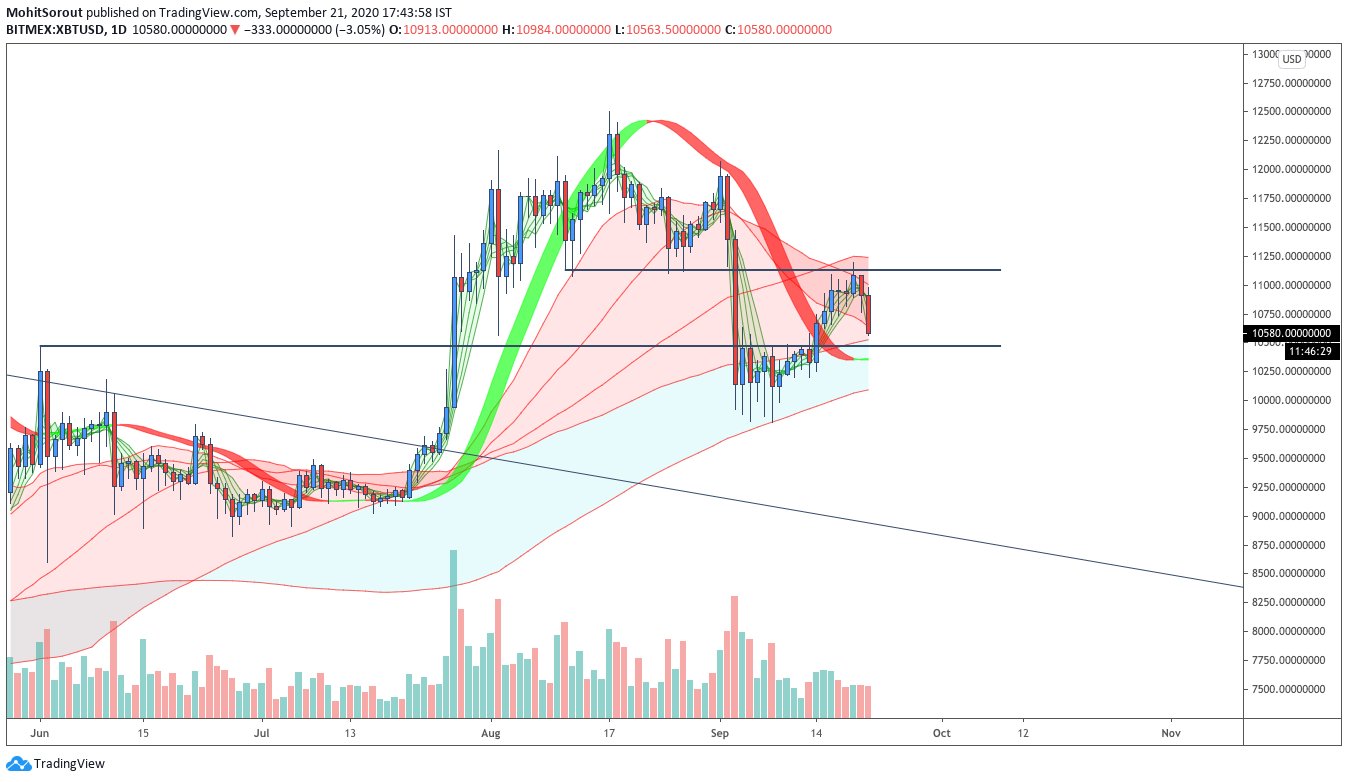
A crucial Bitcoin trend indicator that last formed a buy signal prior to July and August’s $2,500 surge just appeared again.
Crypto fund manager Mohit Sorout recently published the chart below, which shows that this indicator just turned green two days ago. This suggests that Bitcoin is on the verge of continuing its ascent or at least poised to enter a phase of consolidation.
Chart of BTC's price action over the past few weeks with analysis by crypto trader and fund manager Mohit Sorout (@Singhsoro on Twitter).
Chart from TradingView.com
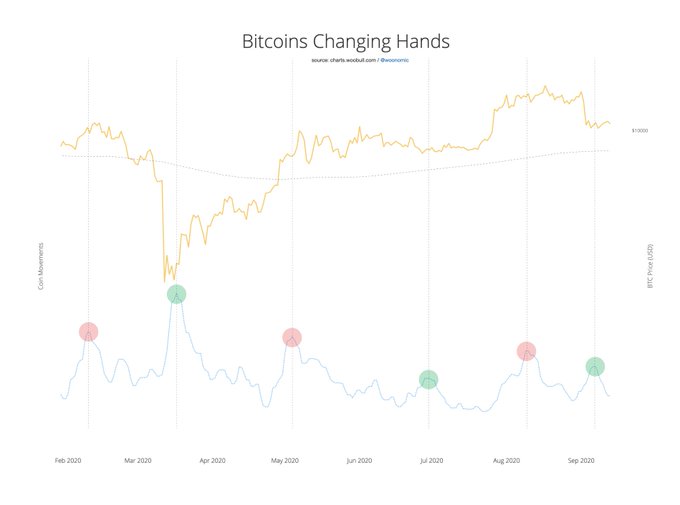
Also suggesting Bitcoin is on the verge of a bullish trend reversal is Willy Woo, an on-chain analyst.
He recently suggested that because the number of BTC that have changed hands on chain has recently spiked, it would be fair to say that a bullish reversal is in the works. He shared the chart, which shows that every time this metric has spiked over recent months, a trend reversal followed.
“Another impulse of coins changing hands has completed, the next directional move over the coming weeks is likely upwards. It’s very unlikely we’ll see any kind of a catastrophic dump in price from here.”
Chart of BTC's price action over the past few months with an on-chain analysis by crypto analyst Willy Woo.
From what the industry now knows, this spike was likely MicroStrategy accumulating tens of thousands of BTC as a reserve asset. Microstrategy is a Nasdaq-listed company that made waves a few weeks ago when it announced that it was acquiring Bitcoin to hedge the company against macroeconomic risks.
Long-Term On-Chain Trends Still Signaling Upside for BTC
Long-term on-chain trends corroborate the sentiment that Bitcoin will continue its ascent.
As reported by Bitcoinist previously, CryptoQuant, a blockchain analytics firm, identified that 10 out of 11 of its long-term on-chain metrics are currently printing a “buy” or “strong buy” for Bitcoin.
Photo by Milad B. Fakurian on Unsplash
Price tags: xbtusd, btcusd, btcusdt
Charts from TradingView.com
This Bitcoin Trend Indicator That Last Appeared Prior to $2,500 Rally Returns
OhNoCryptocurrency via https://www.ohnocrypto.com/ @Nick Chong, @Khareem Sudlow


