“Game On,” Analyst Says as Bitcoin Prints Pivotal Crossover
Bitcoin is forming a pivotal buying signal after weeks of consolidation. The cryptocurrency pushed higher over the past 10 days, which allowed this indicator to trend higher to form the buying signal seen today.
Bitcoin Prints Pivotal Ichimoku Cloud Crossover
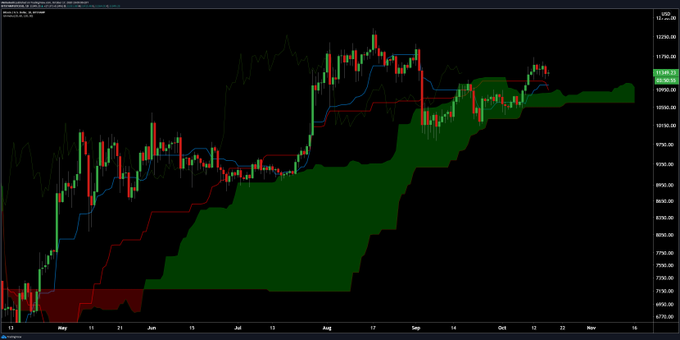
Josh Olszewicz, a crypto-asset analyst, recently noted that the cryptocurrency formed a bullish TK Cross as per the Ichimoku Cloud indicator.
The indicator is a multi-faceted indicator that shows important price levels along with the trend of the asset being analyzed.
The last time this signal was seen was amid the late-July rally that took Bitcoin from the $9,000s to $11,000 and beyond.
This is important as it suggests that the medium-term BTC trend is bullish. It is somewhat of a lagging indicator that follows Bitcoin’s price higher instead of predicting future price movements.
Chart of BTC's price action over the past few months with analysis by crypto trader Josh Olszewicz.
Source: BTCUSD from TradingView.com
Olszewicz noted that the cryptocurrency’s Ichimoku Cloud indicator has an extremely positive hit rate as per historical market data.
He shared a chart indicating that since 2013, the indicator has had an 80% hit rate, marking the start of strong legs higher in previous bull markets. For one, prior to the rally to $20,000, at $3,500 or so, Bitcoin formed this bullish crossover. This historical precedent bodes well for buyers of the leading cryptocurrency.
Expect a Short-Term Reversal
While the long-term outlook for Bitcoin remains strong, the short-term to medium-term outlook may be bearish.
Willy Woo, a prominent on-chain analyst, recently shared the chart seen below.
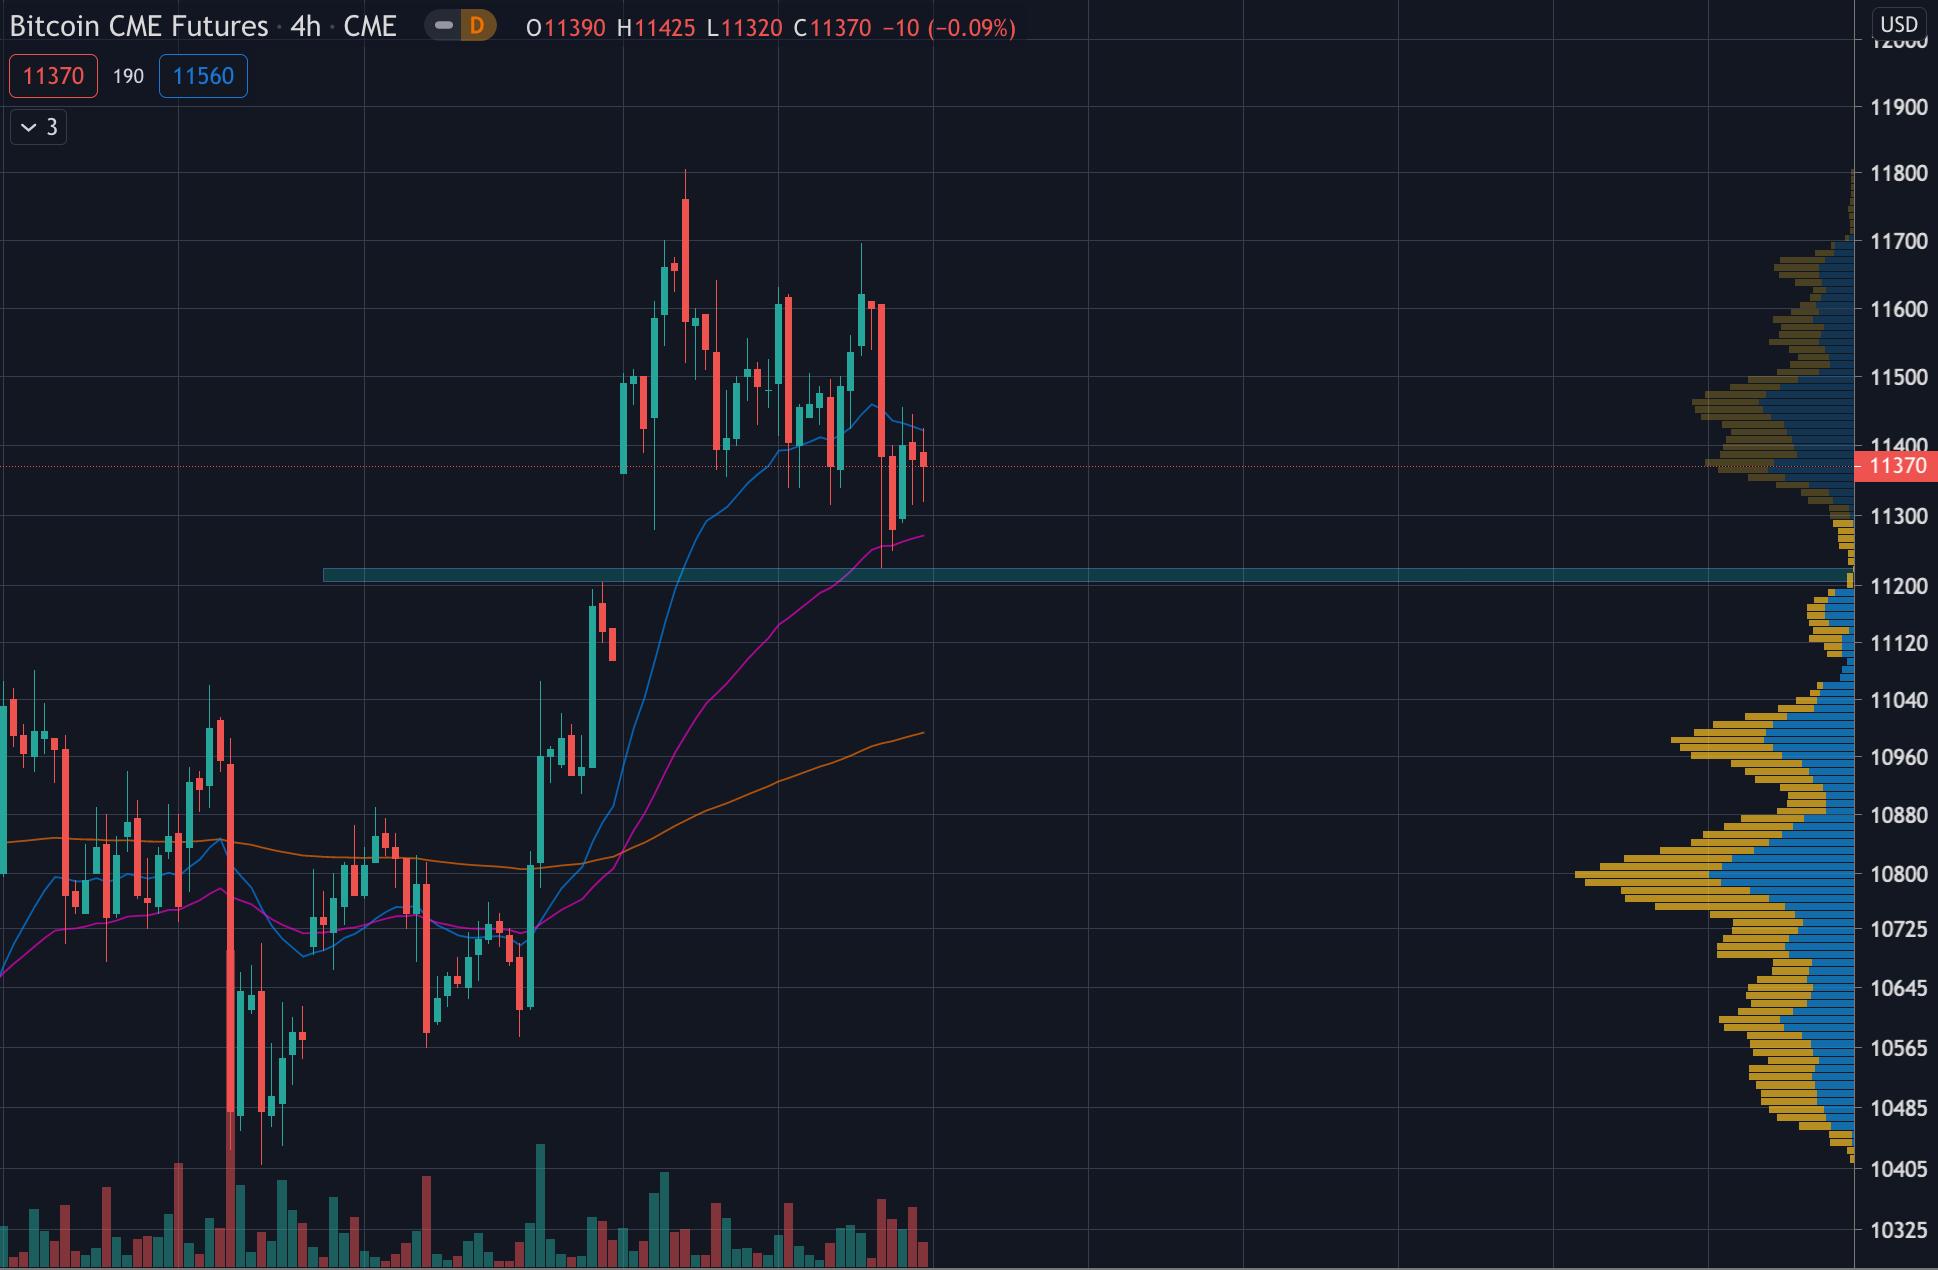
It shows that Bitcoin is likely to retest the CME futures gap formed at $11,200.
“This is short term technical analysis instead of my normal fundamentals; be warned short term analysis is much lower reliability, more for casino players. SUMMARY: I suspect the last CME gap (what’s left of it in green) may get filled.”
As to why he thinks this will take place, Woo noted that there are order book/market trends showing that distribution is taking place under the noses of traders. This means that there has been an increase in selling pressure. Not to mention, the analyst noted that Bitcoin’s recent price action resembles the Wyckoff Distribution textbook pattern, often seen prior to drawdowns.
Chart of BTC's CME futures price action over the past few weeks with analysis by Willy Woo.
Source: BTCUSD from TradingView.com
Featured Image from Shutterstock
Price tags: xbtusd, btcusd, btcusdt
Charts from TradingView.com
"Game On," Analyst Says as Bitcoin Prints Pivotal Crossover
OhNoCryptocurrency via https://www.ohnocrypto.com/ @Nick Chong, @Khareem Sudlow


