It’s Decision Time for Bitcoin as Technicals Suggest a Crucial Breakout Pattern
Bitcoin price is extending its rise above $10,750 against the US Dollar. BTC is now approaching a crucial breakout zone near $10,850, $10,920, and $11,000.
- Bitcoin started a decent recovery wave above the $10,550 and $10,650 resistance levels.
- The price was able to clear the $10,750 resistance and settled above the 100 hourly simple moving average.
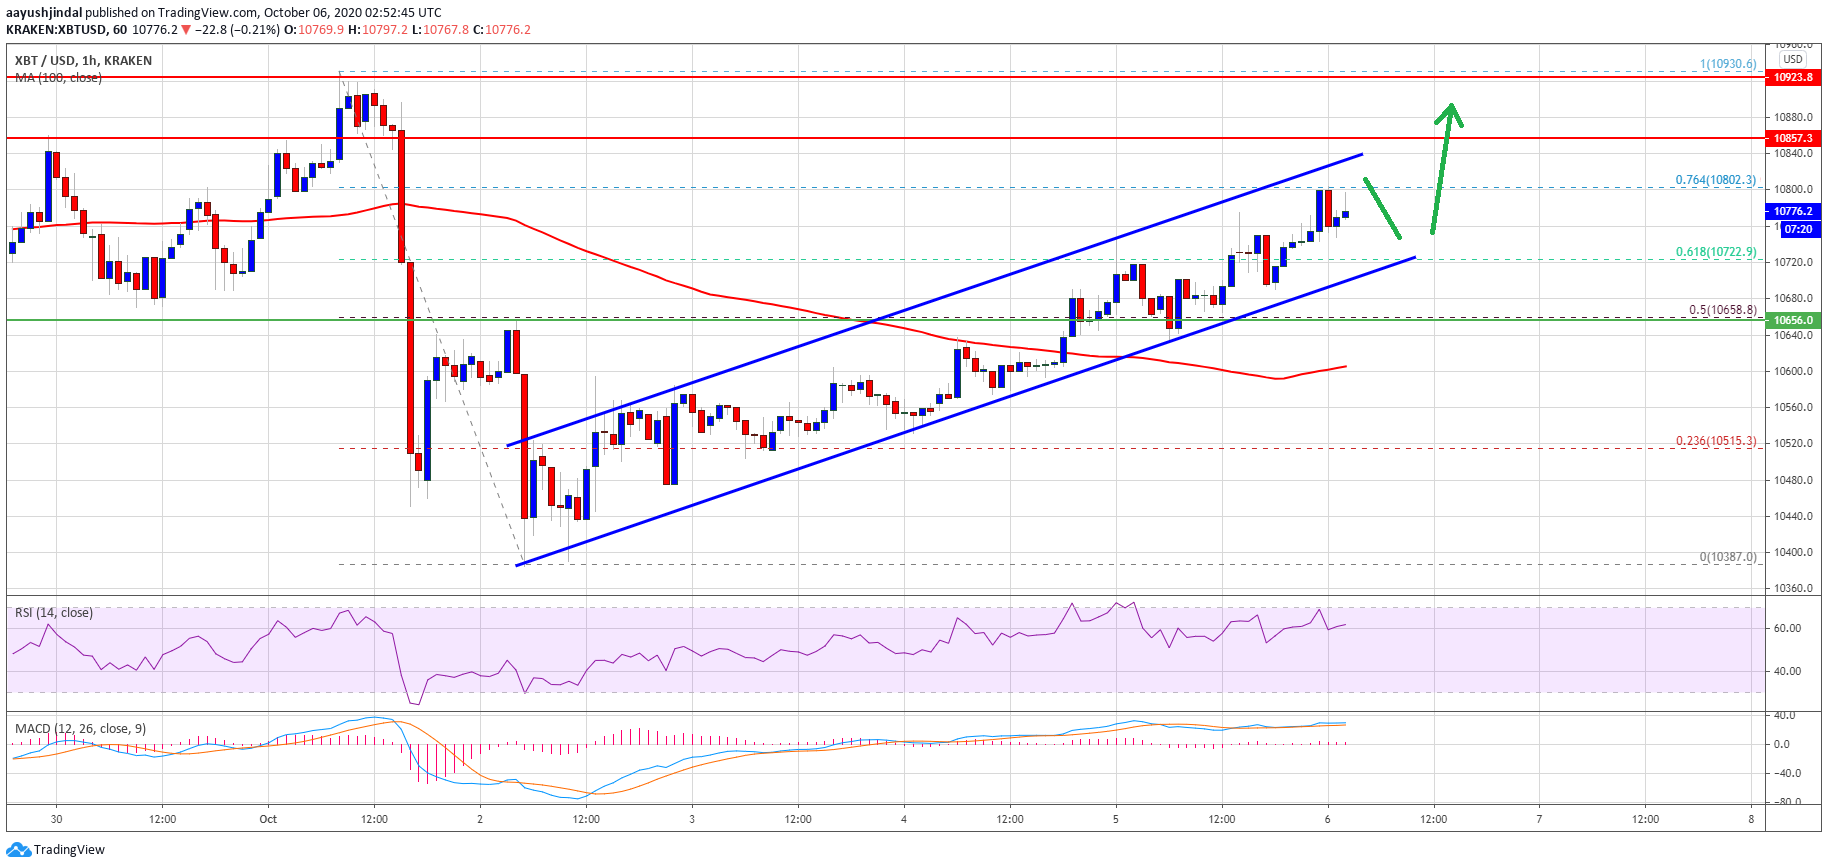
- Yesterday’s highlighted important rising channel is active with support near $10,720 on the hourly chart of the BTC/USD pair (data feed from Kraken).
- The pair is approaching a couple of major hurdles near $10,850, $10,920 and $11,000.
Bitcoin Price is Approaching Major Breakout Zone
Bitcoin price found support near the $10,350 zone and recently started a decent recovery wave against the US Dollar. BTC broke the $10,550 and $10,650 resistance levels to move into a short-term positive zone.
The upward move was such that the price was able to climb above the 50% Fib retracement level of the main drop from the $10,930 high to $10,387 low. The bulls were able to push the price above the $10,750 level and it tested the $10,800 resistance.
The price is currently facing selling interest near the 76.4% Fib retracement level of the main drop from the $10,930 high to $10,387 low. It seems like yesterday’s highlighted important rising channel is active with support near $10,720 on the hourly chart of the BTC/USD pair.
Bitcoin price climbs above $10,750. Source: TradingView.com
The price is now approaching a couple of major hurdles near $10,850, $10,920 and $11,000. A successful daily close above the $11,000 resistance level is needed to start a strong upward move.
The next key resistance is near the $11,200 level, above which the bulls are likely to aim a test of the $11,500 level in the near term.
Another Rejection in BTC?
If bitcoin fails to continue higher above the $10,850 resistance or the $10,920 hurdle, there is a risk of another bearish reaction. An initial support on the downside is the channel trend line at $10,720.
A break below the channel support could lead the price towards the $10,650 support. The next major support is near the $10,600 level since it is close to the 100 hourly simple moving average.
Technical indicators:
Hourly MACD – The MACD is currently struggling to gain momentum in the bullish zone.
Hourly RSI (Relative Strength Index) – The RSI for BTC/USD is currently flat near the 60 level.
Major Support Levels – $10,720, followed by $10,650.
Major Resistance Levels – $10,800, $10,850 and $10,920.
OhNoCrypto
via https://www.ohnocrypto.com
Aayush Jindal, @KhareemSudlow

