TA: Ethereum Recovery Could Soon Fade If ETH Fails To Surpass $355
Ethereum recovered 4% and it climbed above the $350 pivot against the US Dollar. ETH price could still trim gains if it fails to clear the main $355 resistance zone.
- Ethereum started a decent recovery wave above the $345 and $350 resistance levels.
- The price is now well above the 100 hourly simple moving average, but it is facing hurdles near $355.
- There was a break above a key bearish trend line with resistance near $342 on the hourly chart of ETH/USD (data feed via Kraken).
- The pair could start a fresh decrease if there is no upside break above the main $355 resistance.
Ethereum Price Recovers 4%
Ethereum remained well bid above the $335 support level, resulting in a fresh upward move (similar to bitcoin). ETH price surpassed the $340 and $342 levels to start the current recovery wave.
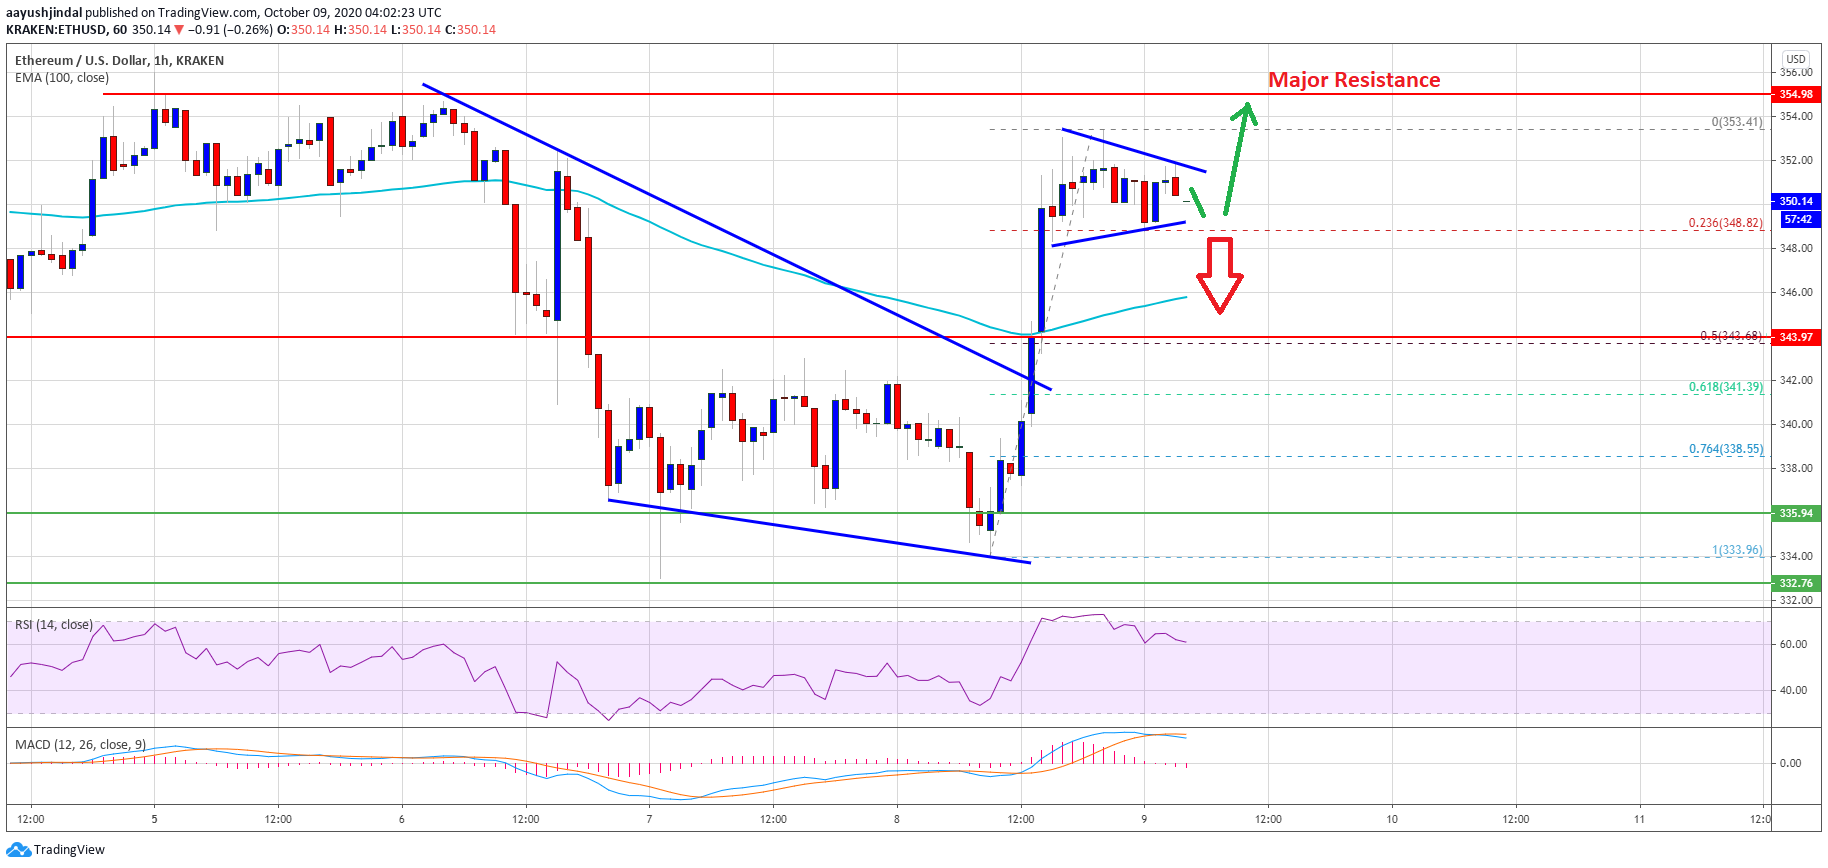
More importantly, there was a break above a key bearish trend line with resistance near $342 on the hourly chart of ETH/USD. Ether price even climbed above the $350 resistance level and settled well above the 100 hourly simple moving average.
The price traded as high as $353 and it is currently consolidating gains. It seems like there is a key contracting triangle forming with support near $349 on the same chart. The triangle support is close to the 23.6% Fib retracement level of the recent increase from the $334 swing low to $353 high.
Ethereum price spikes above $350. Source: TradingView.com
On the upside, an initial resistance is near the triangle trend line at $353. The main resistance is still near the $355 level. A successful daily close above the $355 resistance could open the doors for a sharp rally towards the $365 and $370 levels in the near term. The next key resistance is near the $380 level.
Fresh Drop in ETH?
If Ethereum fails to clear the $353 resistance or $355, there are chances of a fresh drop. The first major support is near the $346 level and the 100 hourly simple moving average.
The next major support for ether is near the $344 level or the 50% Fib retracement level of the recent increase from the $334 swing low to $353 high. Any further losses will most likely clear the path for a drop towards the key $335 support zone.
Technical Indicators
Hourly MACD – The MACD for ETH/USD is slowly moving back into the bearish zone.
Hourly RSI – The RSI for ETH/USD is currently holding the 60 level and it might correct lower.
Major Support Level – $344
Major Resistance Level – $355
OhNoCrypto
via https://www.ohnocrypto.com
Aayush Jindal, @KhareemSudlow

