Bitcoin SV Breaks Range-bound Move, Lacks Buyers on the Upside
Nov 22, 2020 at 13:08 //
NewsYesterday, buyers made concerted efforts to break the three months old sideways trend of the coin. BSV has not been able to trade above the $180 overhead resistance since September.
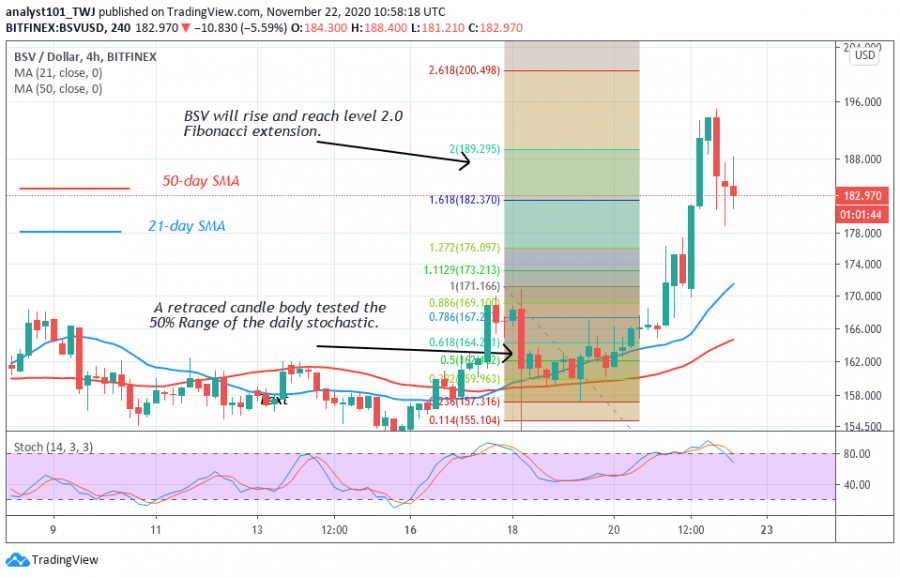
Buyers made several attempts before breaking the $180 overhead resistance. The recent rebound reached a high of $193 but it is facing resistance.
The presence of sellers at the $200 resistance zone is affecting the upward movement of the coin. BSV will continue with the upside momentum if the bulls sustain the bullish momentum above the $180 support. However, if sellers push the price below $180 support, the crypto will resume its sideways move below the overhead resistance.
Bitcoin SV indicator reading
The price has broken above the SMAs which suggest that the coin is likely to rise. Secondly, the recent rebound broke the resistance line of the horizontal channel. When price breaks and closes above the resistance line, it implies that the trend has changed. Presently, the price is retesting the resistance line to break below it. The crypto is above the 75% range of the daily stochastic. It indicates that the coin is in a bullish momentum.

Key Resistance Zones: $320, $340, $360
Key Support Zones: $140, $120, $100
What is the next direction for BSV/USD?
Bitcoin SV has broken the $180 overhead resistance; there is a likelihood of a further upward movement of the coin. On November 17 uptrend; a retraced candle body tested the 50% Fibonacci retracement level. This retracement indicates that the coin will rise and reach level 2.0 Fibonacci extension or the high of $189.29.

Disclaimer. This analysis and forecast are the personal opinions of the author that are not a recommendation to buy or sell cryptocurrency and should not be viewed as an endorsement by CoinIdol. Readers should do their own research before investing funds.
OhNoCryptocurrency via https://www.ohnocrypto.com/ @coinidol.com By Coin Idol, @Khareem Sudlow
