Litecoin May Lose Critical Support as Sellers Approach $60 Low
Nov 27, 2020 at 12:47 //
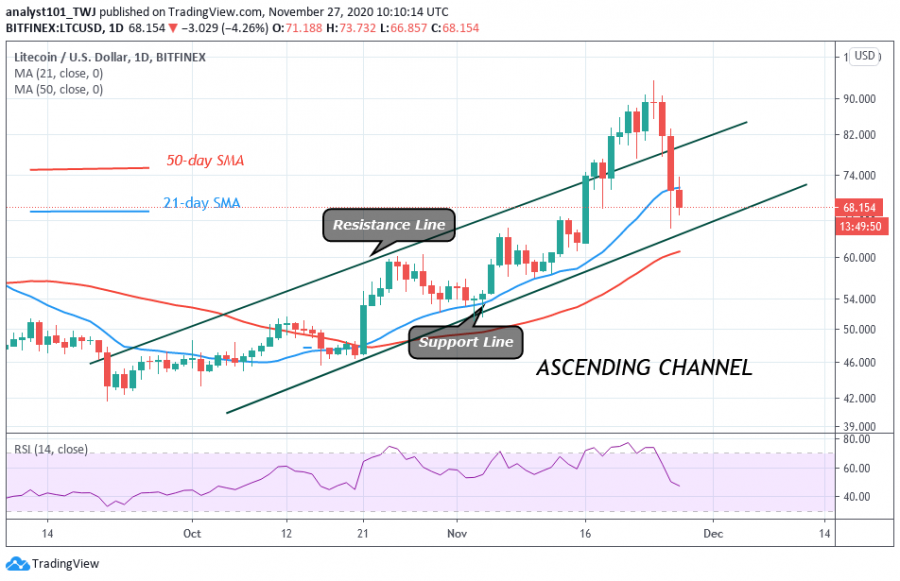
NewsOn November 24, Litecoin rallied to $94 high but could not continue the uptrend. LTC retraced to the $86 low and resumed consolidation between $84 and $90.
On November 25, the bulls retested the $90 high but were repelled. The bearish reaction was overwhelming as the price fell to $65 low. Simultaneously, the bulls buy the dips as price corrected above $70. Today, the crypto is fluctuating above $70.
On the upside, if the current support holds, buyers may want to push the price above $90. The price can rally above $100 if buyers are successful in their current push. Meanwhile, if the current support cracks, the bullish scenario will be invalidated. Once the bears break the $70 support, the downward move will extend to either the $60 or $54 price level.
Litecoin indicator analysis
LTC price has broken the 21-day SMA. A break below the 21-day and 50-day SMAs will mean a downward movement of the coin. The crypto will be fully in the bearish trend zone once the SMAs are broken. The coin is at level 48 of the Relative Strength Index period 14. It indicates that the coin is in the downtrend zone and below the centerline 50.

Key Resistance levels: $80, $100, $120
Key Support levels: $50, $40, $20
What is the next move for Litecoin?
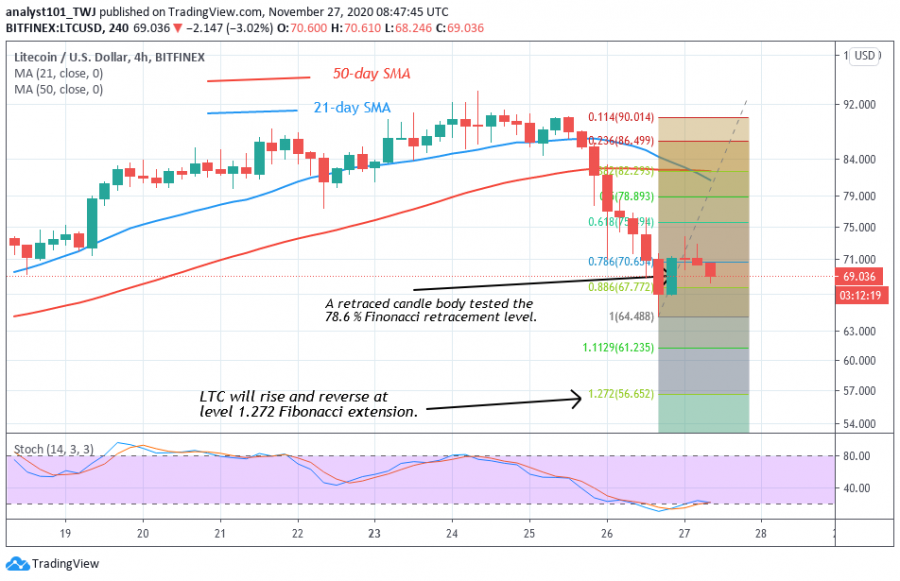
In the current breakdown of yesterday, Litecoin fell to $64 low and corrected upward. During the November 26 downtrend, a retraced candle body tested the 78.6% Fibonacci retracement level. The implication is that the coin will fall to level 1.272 Fibonacci extension and reverse. That is the coin will reverse at $56.65 but the reversal will not be immediate.

Disclaimer. This analysis and forecast are the personal opinions of the author that are not a recommendation to buy or sell cryptocurrency and should not be viewed as an endorsement by CoinIdol. Readers should do their own research before investing funds.
OhNoCryptocurrency via https://www.ohnocrypto.com/ @coinidol.com By Coin Idol, @Khareem Sudlow

