Ethereum Shows Signs of Decline but Overcomes Rejection at $640
Dec 27, 2020 at 12:46 //
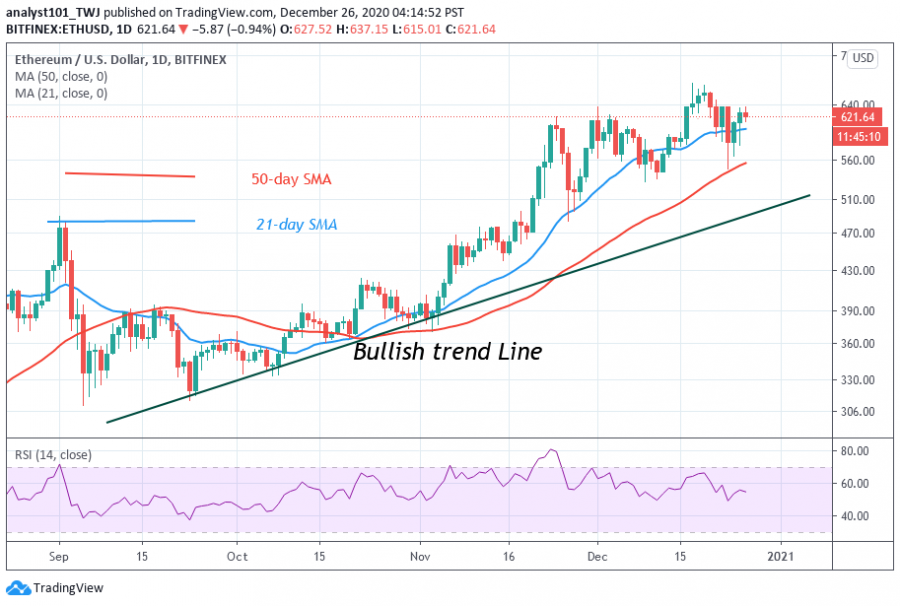
NewsEthereum has continued to trade below the $660 resistance. Like the other altcoins, Ether has failed to break its current resistance level.
The crypto will decline if it fails to break the current resistance. Besides, the other altcoins have resumed downward movement after failing to break their respective resistance level. On the downside, if Ether falls, the coin will reach a low of $540. On the upside, if Ether has continued like Bitcoin, the crypto would have reached a high of $760.
Ethereum indicator analysis
Ether may fall but if it falls and breaks below the bullish trend line, the current trend is presumed to have been terminated. A break below the SMAs will facilitate the downward move. The Relative Strength Index is at level 55. It means that the coin is in the bullish trend zone.

Key Resistance Zones: $800, $820, $840
Key Support Zones: $440, $420, $400
What is the next direction for Ethereum?
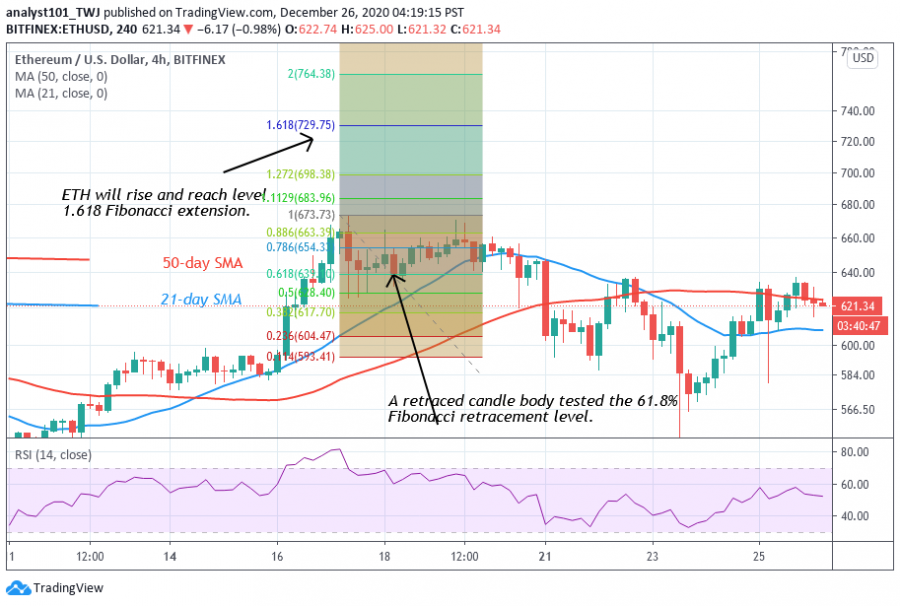
Since Ethereum is trading marginally, the price action has remained the same. The Fibonacci tool analysis will remain the same. On December 17 uptrend; a retraced candle body tested the 61.8% Fibonacci retracement level. This retracement indicates that ETH will rise and reach the level of 1.618 Fibonacci extensions. That is Ethereum will reach a high of $729.75.

Disclaimer. This analysis and forecast are the personal opinions of the author that are not a recommendation to buy or sell cryptocurrency and should not be viewed as an endorsement by CoinIdol. Readers should do their research before investing funds.
OhNoCryptocurrency via https://www.ohnocrypto.com/ @coinidol.com By Coin Idol, @Khareem Sudlow

