TA: Ethereum Rising Steadily, Why ETH Could Surge Past $600
Ethereum remained in a positive zone above $580 against the US Dollar, similar to bitcoin. ETH price is likely to accelerate higher once it clears the $595 and $600 resistance levels.
- Ethereum found support near the $575 level and started a fresh increase.
- The price is now trading above the $590 zone and the 100 hourly simple moving average.
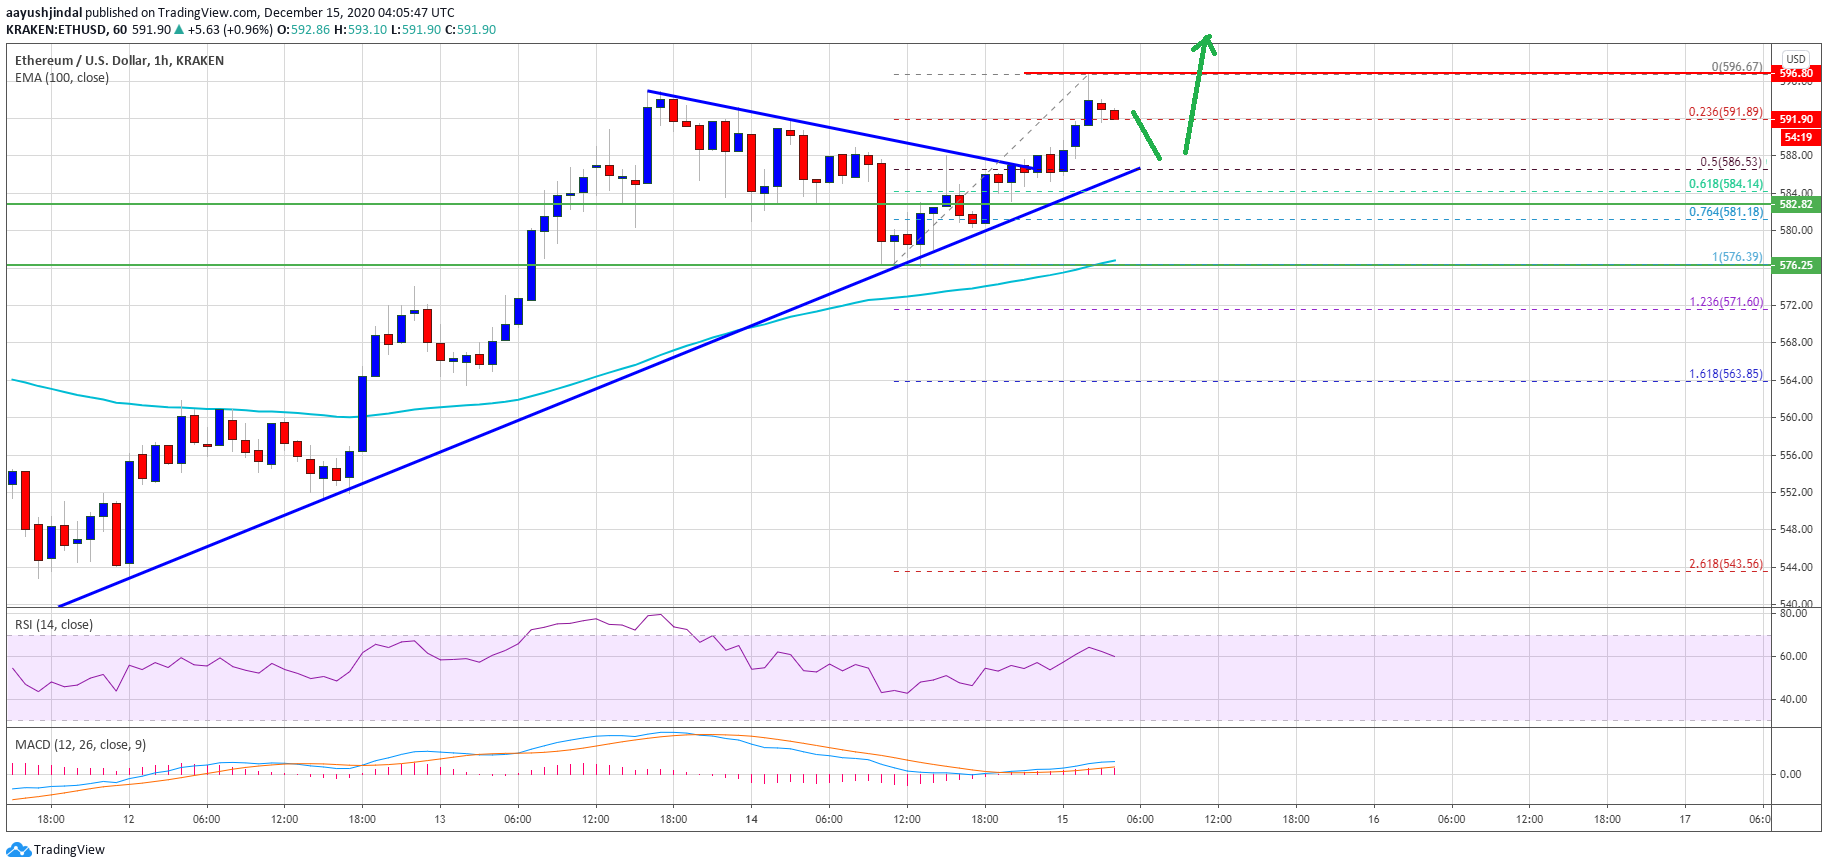
- There was a break above a key bearish trend line with resistance near $586 on the hourly chart of ETH/USD (data feed via Kraken).
- The pair could correct lower, but it is likely to attempt a crucial upside break above $600.
Ethereum Price Gaining Momentum
After testing the $595 zone, Ethereum corrected lower. ETH traded below the $580 support level, but the bulls were able to protect the $575 support zone.
A swing low was formed near the $576 level before the price started a fresh increase. There was a strong upward move above the $580 and $585 levels. There was also a break above a key bearish trend line with resistance near $586 on the hourly chart of ETH/USD.
Ether price climbed above the $590 level and even spiked above $595. A new monthly high is formed near $596 and the price is currently consolidating gains. An initial support is near the $590 level or the 23.6% Fib retracement level of the recent increase from the $576 swing low to $596 high.
Source: ETHUSD on TradingView.com
Moreover, there is a crucial bullish trend line forming with support near $585 on the same chart. The trend line is close to the 50% Fib retracement level of the recent increase from the $576 swing low to $596 high.
On the upside, the price is clearly facing a strong resistance near the $595 level. The current price action suggests that ether could make another attempt to clear $595. The next major resistance is still near the $600 level. A close above the $600 level could accelerate gains.
Dips Limited in ETH?
If ethereum fails to clear the $595 and $596 resistance levels, it could start a downside correction. The first key support zone is near the $585 level and the trend line.
A downside break below the trend line support and $585 could push the price towards the $575 support zone. The 100 hourly simple moving average is also waiting near the $575 zone to provide support.
Technical Indicators
Hourly MACD – The MACD for ETH/USD is now gaining momentum in the bullish zone.
Hourly RSI – The RSI for ETH/USD is currently correcting lower towards the 55 level.
Major Support Level – $585
Major Resistance Level – $595
OhNoCrypto
via https://www.ohnocrypto.com
Aayush Jindal, @KhareemSudlow

