Cosmos price analysis: bullish bias points ATOM towards $10
Cosmos (ATOM) price could jump to $10.00 if bulls manage to keep prices above the upper limit of an ascending parallel channel
Cosmos is among a handful of altcoins trading double digits on the day as they target new highs. Polkadot (DOT) has also surged by more than 30% to cut above $14.00, while ChainLink is looking to hit $20.00 after surging 16% in the past 24 hours.
For Cosmos, trading with a bullish bias could help its price surpass $10 in the next few sessions. This will likely be the scenario if bulls manage to close above $8.00 on the daily chart.
At the time of writing, the token is changing hands just above $8.00, up by more than 29% in the past 24 hours.
ATOM/USD price outlook

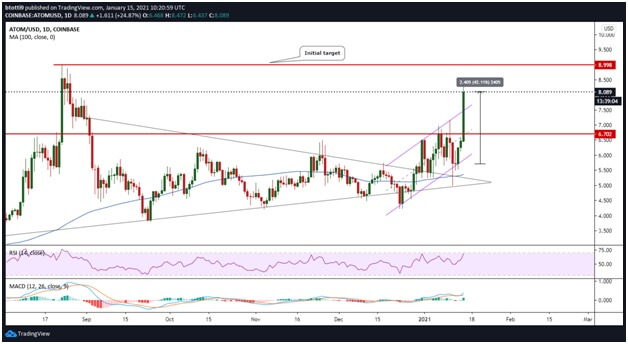
ATOM/USD daily chart. Source: TradingView
Cosmos is trading above an ascending parallel channel that materialised after a breakout from a contracting triangle pattern towards the end of December last year.
The upside also comes after bulls managed to regroup following a dip to support at the lower boundary of the parallel channel around $5.70. Previously, ATOM had sunk below the 100-SMA ($5.36) and touched lows of $4.98.
After breaking above the aforementioned channel’s upper boundary, bulls raced to highs of $8.48. That helped establish support at $6.07, a previous horizontal resistance level. Currently, buyers are struggling with downside pressure, but the strengthening MACD and upturned RSI on the daily chart suggests another leg up is likely.
If we see a daily close above $8.00, the next target is $8.99. Bypassing this level could see buyers focus on $10.00.
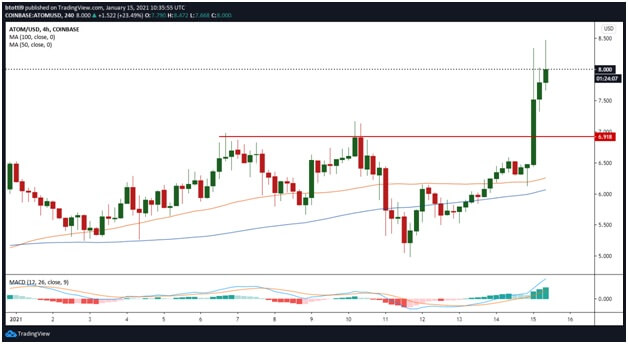
The 4-hour chart also shows that bulls are facing increased pressure as suggested by the candlestick patterns. However, both the RSI and the MACD indicate bulls are in command. If ATOM/USD remains above the previous resistance-turned-support line at $6.90, bulls have the room to attempt a break to the stated target (daily chart).

ATOM/USD 4-hour chart. Source: TradingView
On the contrary, the 50-day SMA ($6.25) and 100-day SMA ($6.07) provide initial support levels on the 4-hour chart. An increased presence of shorts at these levels could, however, suggest a broader correction.
Notably, the hourly RSI is turning from overbought conditions and the hourly MACD is suggesting a weakening bullish bias. But the 4-hour and daily charts feature these technical indicators in bullish mode. This suggests a short term retreat might be the opportunity bulls need to freshen up.
However, if prices slide further, the main anchor will be at $5.00. More losses could see bulls seek to defend their territory near a robust support base marked by the horizontal line at $4.50.
The post Cosmos price analysis: bullish bias points ATOM towards $10 appeared first on Coin Journal.
OhNoCrypto
via https://www.ohnocrypto.com
Benson Toti, @KhareemSudlow
