ETH slips below $1,300 just hours after ATH: Here’s why it could worsen
Ethereum (ETH) reached a new all-time high of $1,440 but is in danger of dropping further below $1,300
ETH/USD traded at a new all-time high of $1,440 yesterday, but an increase in sell-off pressure has pushed it progressively lower. It has touched lows of $1,269 and remains vulnerable to more slips as per the outlook of key on-chain metrics.
This perspective is shared by on-chain analytics platform Santiment, which says that some signals suggest ETH could turn bearish in the short term.
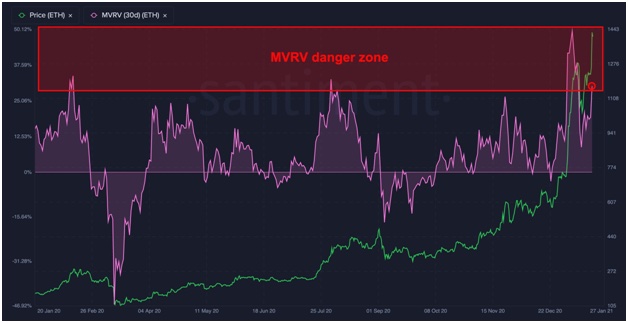
One of the signals that a top might be in for ETH/USD is the MVRV indicator. The MVRV ratio helps gauge if an asset’s exchange-traded price lags the “fair value”. It also helps indicate price tops and bottoms.
According to Santiment, “Ethereum’s 30-day MVRV ratio is in red territory. It’s lower than on previous top but still overinflated“. The 30-day MVRV is at 30%, which the firm says is “a danger zone“.

MVRV chart for Ethereum. Source: Santiment
Ethereum supply on exchanges has also spiked over the past 24 hours to suggest investors have moved their coins onto exchanges and are ready to sell. If more holders decide to cash in on the recent price spike, increased downward pressure will likely push ETH/USD further lower.
ETH/USD price
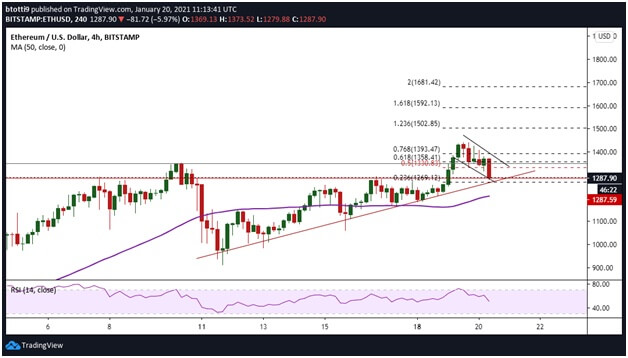
A downside correction has forced ETH to retreat below the critical price level of $1,300, suggesting the momentum that took bulls to the ATH could fade sooner than expected. There is a declining parallel channel formation strengthening on the 4-hour chart.
This outlook, with the price having touched $1,269, means declines to $1,250—$1,200 levels could invite even more selling pressure.

ETH/USD 4-hour chart. Source: TradingView
Ethereum’s downward action has included a retest of the 23.6% Fibonacci retracement level of the recent move from $1,233 low to $1,440 high. Bears are now looking to break lower, with $1,233 offering the main point of interest in the short term.
If the price drops below the support of an ascending trendline, the next major target will be the 50-SMA level near $1,209.
While it looks grim for ETH bulls, there’s every chance a flip puts a brake on the rot. In such an event, bulls face strong resistance at $1,358 (61.8% Fibonacci retracement level of swing high from $1,233 low to $1,440 high).
From here, a close above the upper boundary of the channel ($1,393 on the 4-hour chart) could open up room for bulls to retest the all-time high zone.
A clear break above the ATH and sustained pressure towards upper limits of $1,500—$1,600 could see $2k level come into the picture.
The post ETH slips below $1,300 just hours after ATH: Here’s why it could worsen appeared first on Coin Journal.
OhNoCrypto
via https://www.ohnocrypto.com
Benson Toti, @KhareemSudlow
