Ripple price analysis: XRP hints at a massive breakout to $0.40
Ripple (XRP) could break above $0.30 and rally higher, with bulls likely to target $0.40 in the next wave
XRP has traded sideways for the last few days, with its lack of meaningful upside action allowing Polkadot (DOT) to overtake it as the fourth-largest cryptocurrency by market cap.
Ripple’s underperformance since the SEC filed a lawsuit against the company and its top executives meant that it was always likely that its position would be taken by top performers like DOT.
However, Ripple may be back in the top three if its price breaks out of consolidation and moves towards retesting the 50-day simple moving average on the daily chart. If this happens, XRP could then rally to new year-to-date highs.
At the time of writing, Ripple’s native token is up by 3.2% and is trading around $0.28.
Ripple price
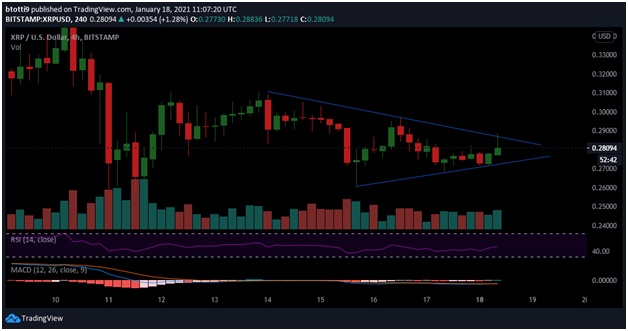
The 4-hour chart shows that buying pressure is increasing, with the Relative Strength Index (RSI) suggesting a positive divergence above the 50 line.

XRP/USD 4-hour chart. Source: TradingView
The MACD is also suggesting a hidden bullish flip, with the shorter 12-day curve hinting at crossing above the 26-day EMA curve. If the indicator strengthens in coming sessions, expect the momentum to turn bulls’ way, with XRP then trading higher.
The chart also shows that XRP is also trading above the 100-day simple moving average. If buyers sustain the upside momentum and crack resistance at the 50-SMA on the 4-hour chart ($0.29), extended action above $0.30 could see XRP/USD squeeze off its sideways range.
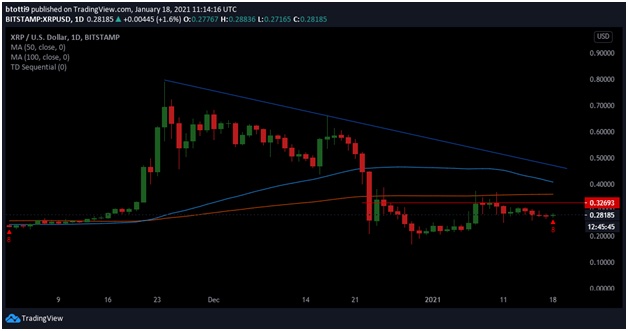
The daily chart presents two targets above the $0.30 price level that could be pivotal in XRP’s short term price action. The first one is a horizontal resistance line just above $0.32. Previous attempts to break higher have run to a halt at this level.
If bulls manage to turn this barrier into support, having higher daily candlesticks will offer the cushion buyers might need as they target the 100-day simple moving average at $0.36.

XRP/USD daily chart. Source: TradingView
The technical outlook for XRP also suggests a potential buy signal on the daily chart. If the signal flashes in the form of a red nine candlestick in the next session, an influx of buyers on surging volumes will likely propel XRP/USD higher.
That means breaking above $0.36 has the prospect of catalysing further upside action. If this happens, XRP could retest resistance at the 50-day SMA ($0.40).
The flipside of the above bullish picture will be a dip to initial support at $0.25. if bearish pressure increases around these price levels, it could mean a further retreat to the long term support zone near $0.20.
The post Ripple price analysis: XRP hints at a massive breakout to $0.40 appeared first on Coin Journal.
OhNoCrypto
via https://www.ohnocrypto.com
Benson Toti, @KhareemSudlow
