TA: Ethereum Corrects $200: Why ETH Remains Attractive Near 100 SMA
Ethereum traded to a new yearly high at $1,280 before correcting lower against the US Dollar. ETH price declined over $200, but the bulls were active near the 100 hourly simple moving average.
- Ethereum gained pace above $1,200 and it traded to a new multi-month high near $1,280.
- The price is correcting gains, but it is well bid above $1,100 and the 100 hourly simple moving average.
- There was a break below a major bullish trend line with support near $1,225 on the hourly chart of ETH/USD (data feed via Kraken).
- The pair is likely to continue higher as long as it is above the $1,100 level and the 100 hourly SMA.
Ethereum Price Corrects Sharply
There was a strong upward move yesterday in bitcoin and Ethereum above $28,500 and $1,200 respectively. ETH price even spiked above the $1,250 level and traded to a new multi-month high near $1,280.
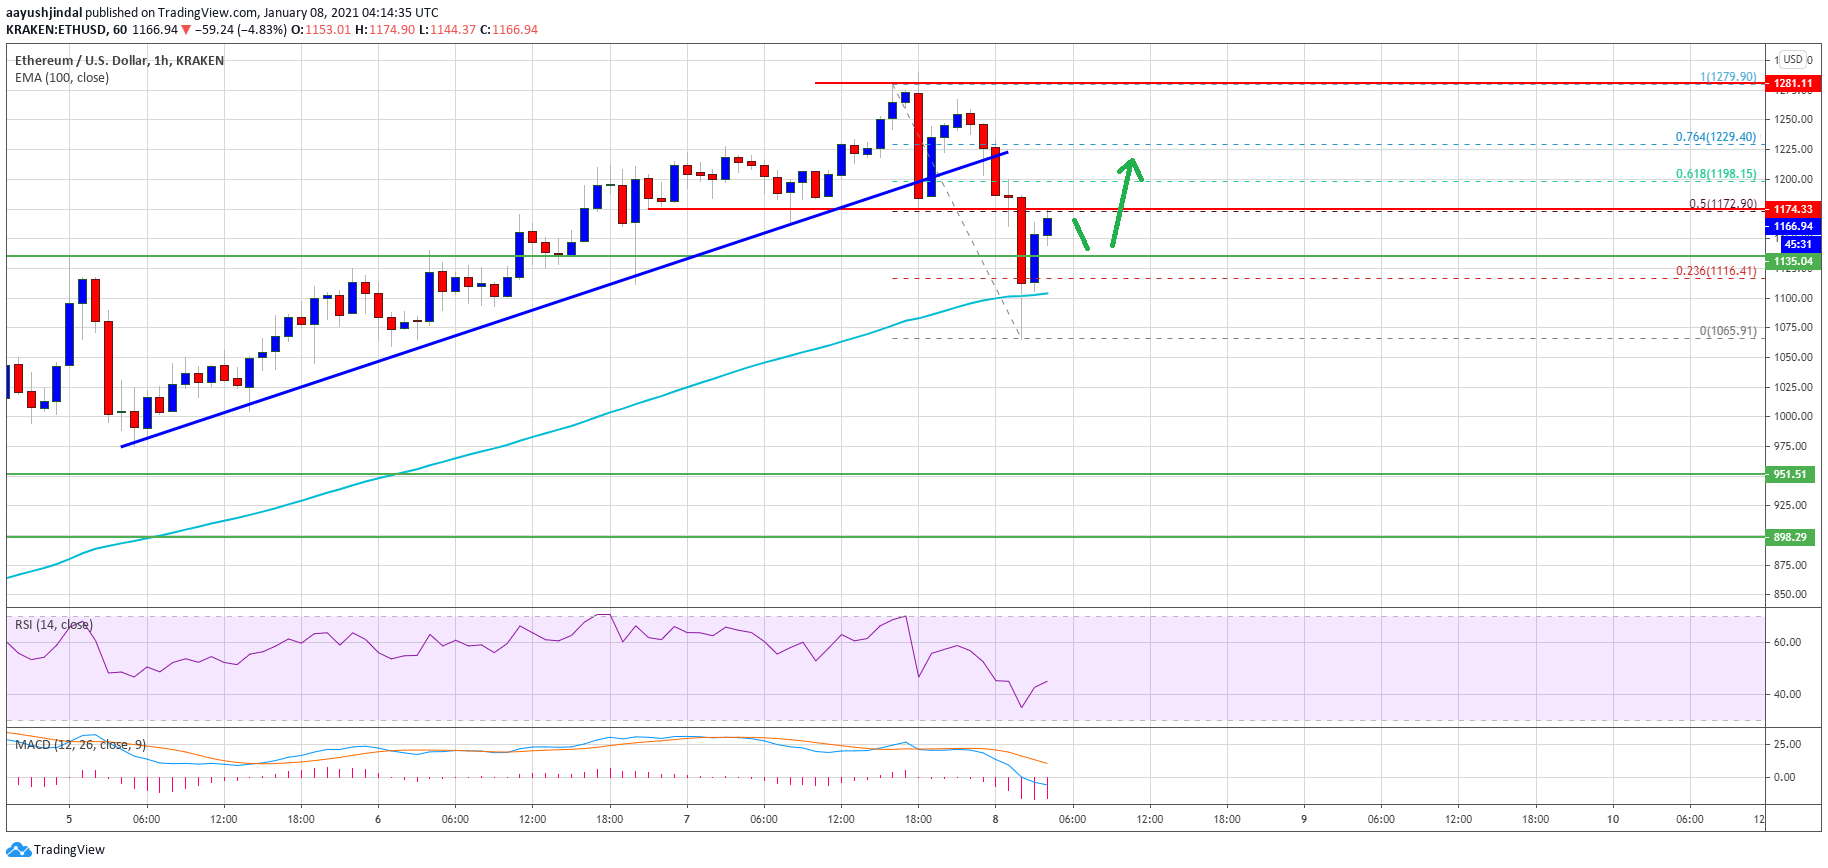
Recently, there was a sharp downside correction below the $1,200 level. Ether price declined over $200 and it even spiked below the $1,100 level. There was also a break below a major bullish trend line with support near $1,225 on the hourly chart of ETH/USD.
However, the bulls remained active near the 100 hourly simple moving average. A low is formed near $1,065 and the price is currently rising. It broke the $1,100 level and trading nicely above the 100 hourly SMA.
Source: ETHUSD on TradingView.com
Ether climbed above the 23.6% Fib retracement level of the downside correction from the $1,279 high to $1,065 low. It is now facing hurdles near the $1,175 and $1,180 levels (a key breakdown zone).
The 50% Fib retracement level of the downside correction from the $1,279 high to $1,065 low is also acting as a resistance for the bulls. If there is a clear break above $1,180 and a follow up move above $1,200, the price could start a fresh increase towards the $1,280 and $1,300 levels.
Dips Limited in ETH?
If ethereum fails to clear the $1,180 and $1,200 resistance levels, it could start another downside correction. An initial support on the downside is near the $1,135 level.
The main support is now forming near the $1,100 level and the 100 hourly SMA. If there is a close below the 100 hourly SMA, the price could decline heavily towards the $1,000 support level.
Technical Indicators
Hourly MACD – The MACD for ETH/USD is slowly gaining pace in the bullish zone.
Hourly RSI – The RSI for ETH/USD is currently recovering towards the 45 level.
Major Support Level – $1,100
Major Resistance Level – $1,200
OhNoCrypto
via https://www.ohnocrypto.com
Aayush Jindal, @KhareemSudlow

