Bitcoin Cash Breaks Downtrend Line, Poises for Upward Move Soon
Feb 03, 2021 at 13:47 //
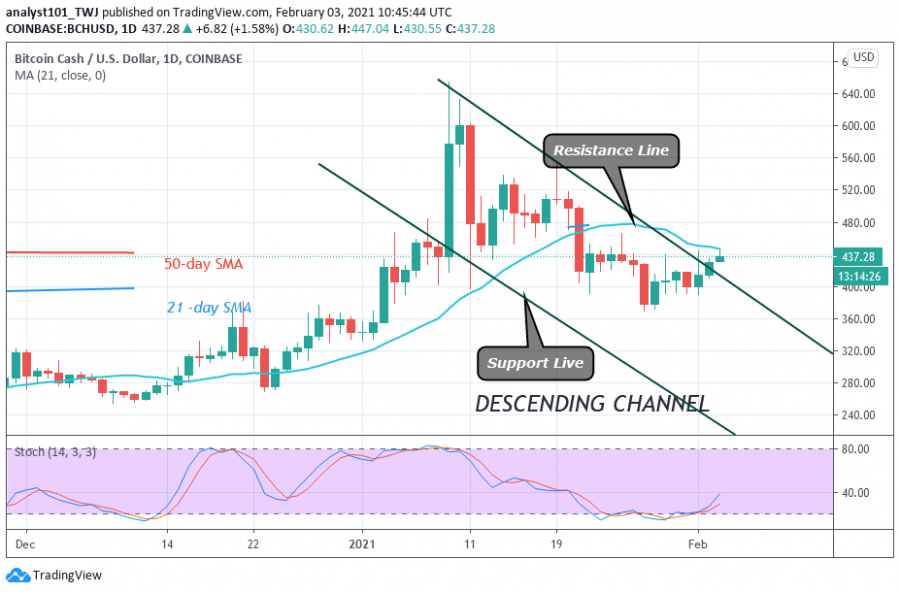
NewsBitcoin Cash (BCH) has been trending upward since the beginning of February 2021. Today, on February 3, the price was resisted at the $440 resistance. Bitcoin Cash immediately fell to the 21-day SMA support and resumed upward.
Bitcoin Cash price Long-term Analysis: Bullish
Since January 21 and 27 downtrends, the bulls have failed to break above the $440 resistance. Rather, the BCH price has been making a series of lower highs and lower lows.
In other words, Bitcoin Cash has been correcting lower since January 10. On the upside, if buyers can break above the $440 resistance, a rally above $480 is likely. The coin will be in the bullish trend zone. There are instances that the coin will rise to retest the $539 resistance. Failure of the bulls to break the current resistance will lead to a range-bound movement between $390 and $440.
Bitcoin Cash Indicator Reading
BCH price has partially broken the resistance line of the descending channel. The current trend will change if price breaks and closes above the resistance line of the channel. The trend will change if the current bullish momentum is sustained.

Technical indicators:
Major Resistance Levels – $440 and $480
Major Support Levels – $400 and $360
What Is the Next Move for Bitcoin Cash (BCH)?
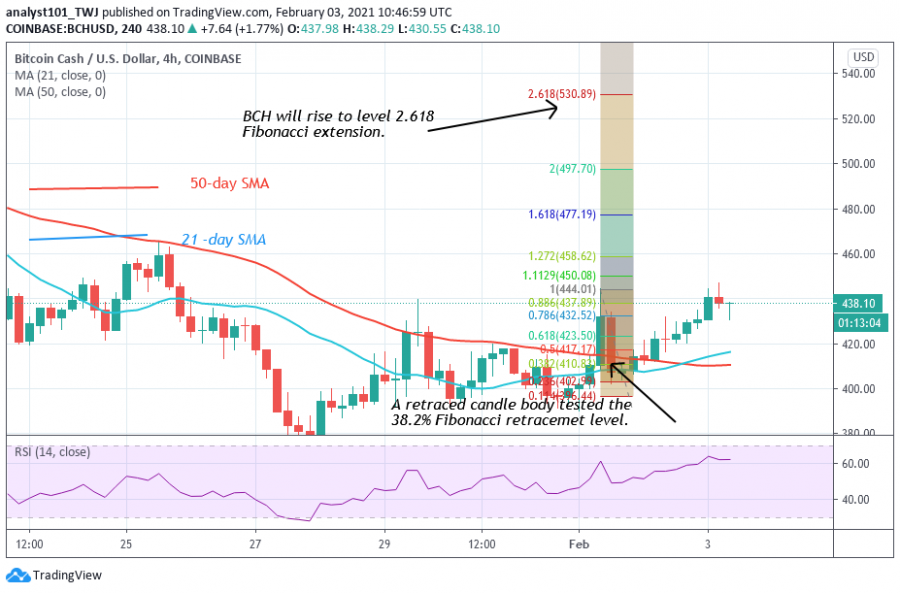
BCH has been trending since January 28. On February 1 uptrend; the retraced candle body tested the 38.2% Fibonacci retracement level. The retracement indicates that BCH is likely to rise to level 2.618 Fibonacci extensions. In other words, BCH will rise to a high of $530.89.

Disclaimer. This analysis and forecast are the personal opinions of the author and not a recommendation to buy or sell cryptocurrency and should not be viewed as an endorsement by Coin Idol. Readers should do their own research before investing funds.
OhNoCryptocurrency via https://www.ohnocrypto.com/ @coinidol.com By Coin Idol, @Khareem Sudlow
