Bitcoin Price Rallies Above $51,000. Can Bulls Sustain the Bullish Momentum?
Feb 17, 2021 at 12:42 //
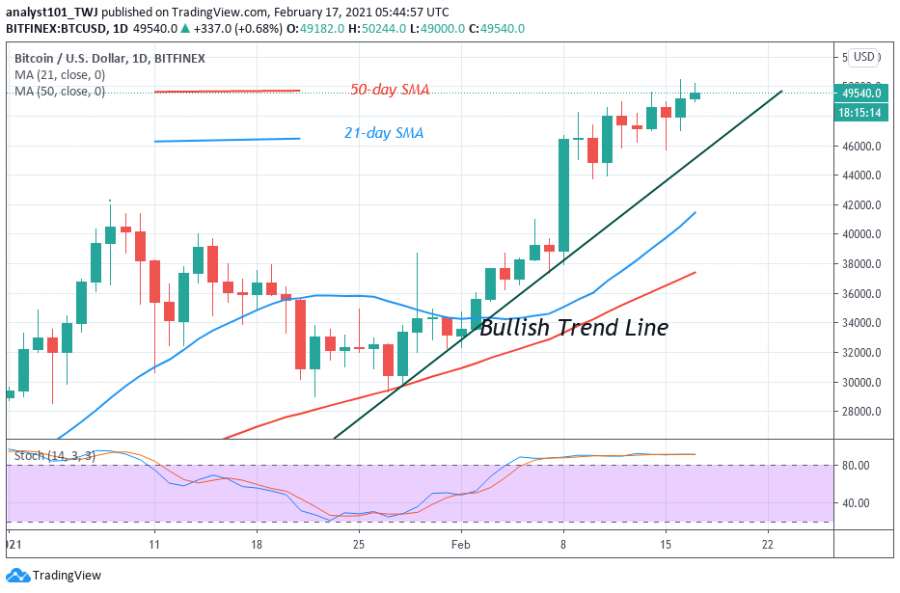
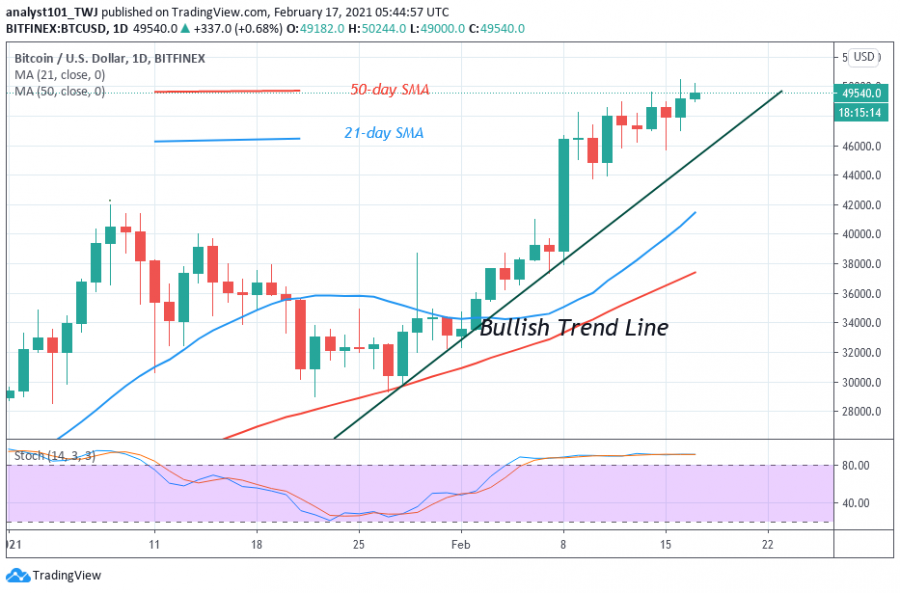
NewsBitcoin (BTC) bulls are closing on breaking the $50,000 resistance level. Today, in the first attempt BTC price rose to $50,244 high and pulled back. On February 17, at the time of writing Bitcoin reached $51,127.
Bitcoin Price Long-Term Prediction: Bullish
Despite the pullback, buyers have continued to push the price above the psychological price level. Yesterday, buyers pushed the price to a high of $50,490 but were repelled. After the resistance, the daily candlestick closed with a long wick. The long upper shadow indicates that there is a strong selling pressure above the $50,000 resistance. In other words, buyers attempted to bid the price higher but sellers came in to push the price down near the open price.
In yesterday’s price action, BTC’s price fell from $50,490 to a $48,000 low. In today’s price movement the resistance was broken but buyers are struggling to sustain the bullish momentum. The cryptocurrency is making a fresh upward move. Analysts have opined that if the $50,000 resistance is breached, Bitcoin will have an accelerated price movement on the upside. Nonetheless, if the bulls break the $50,000 resistance and bullish momentum is sustained, this will propel the price to rise and rally above the $60,000 high. However, if BTC price faces another rejection, the market will drop to as low as $44,000. Meanwhile, the price has broken above the resistance as Bitcoin reached a high of $50,880 at the time of writing.
Bitcoin (BTC) Indicator Reading
Bitcoin price is above the 80% range of the daily Stochastic. It indicates that BTC is in a strong bullish momentum. Since February 4, the market has remained in the overbought region as price continues its upside momentum. The Relative Strength Index is at level 66 which indicates that price is near the overbought region.

Technical indicators:
Major Resistance Levels – $50,000 and $54,000
Major Support Levels – $48,000 and $44,000
What Is the Next Direction for BTC/USD?
The cryptocurrency has broken the $50,000 overhead resistance. It appears the momentum is likely to sustain. The Fibonacci tool analysis is likely to hold. On February 9 uptrend; a retraced candle body tested the 78.6 % Fibonacci retracement level. The retracement indicates that BTC will rise to level 1.272 Fibonacci extension. That is the high of level $51,076.30. Presently, the market is rising to this level. According to the Fibonacci tool, the BTC price will reverse from the recent high to 78.6% Fibonacci retracement level where it originated.

Disclaimer. This analysis and forecast are the personal opinions of the author and not a recommendation to buy or sell cryptocurrency and should not be viewed as an endorsement by CoinIdol. Readers should do their own research before investing funds.
OhNoCryptocurrency via https://www.ohnocrypto.com/ @coinidol.com By Coin Idol, @Khareem Sudlow
