Charted: Binance Coin (BNB) Trades To Record High At $175, $200 Still Possible
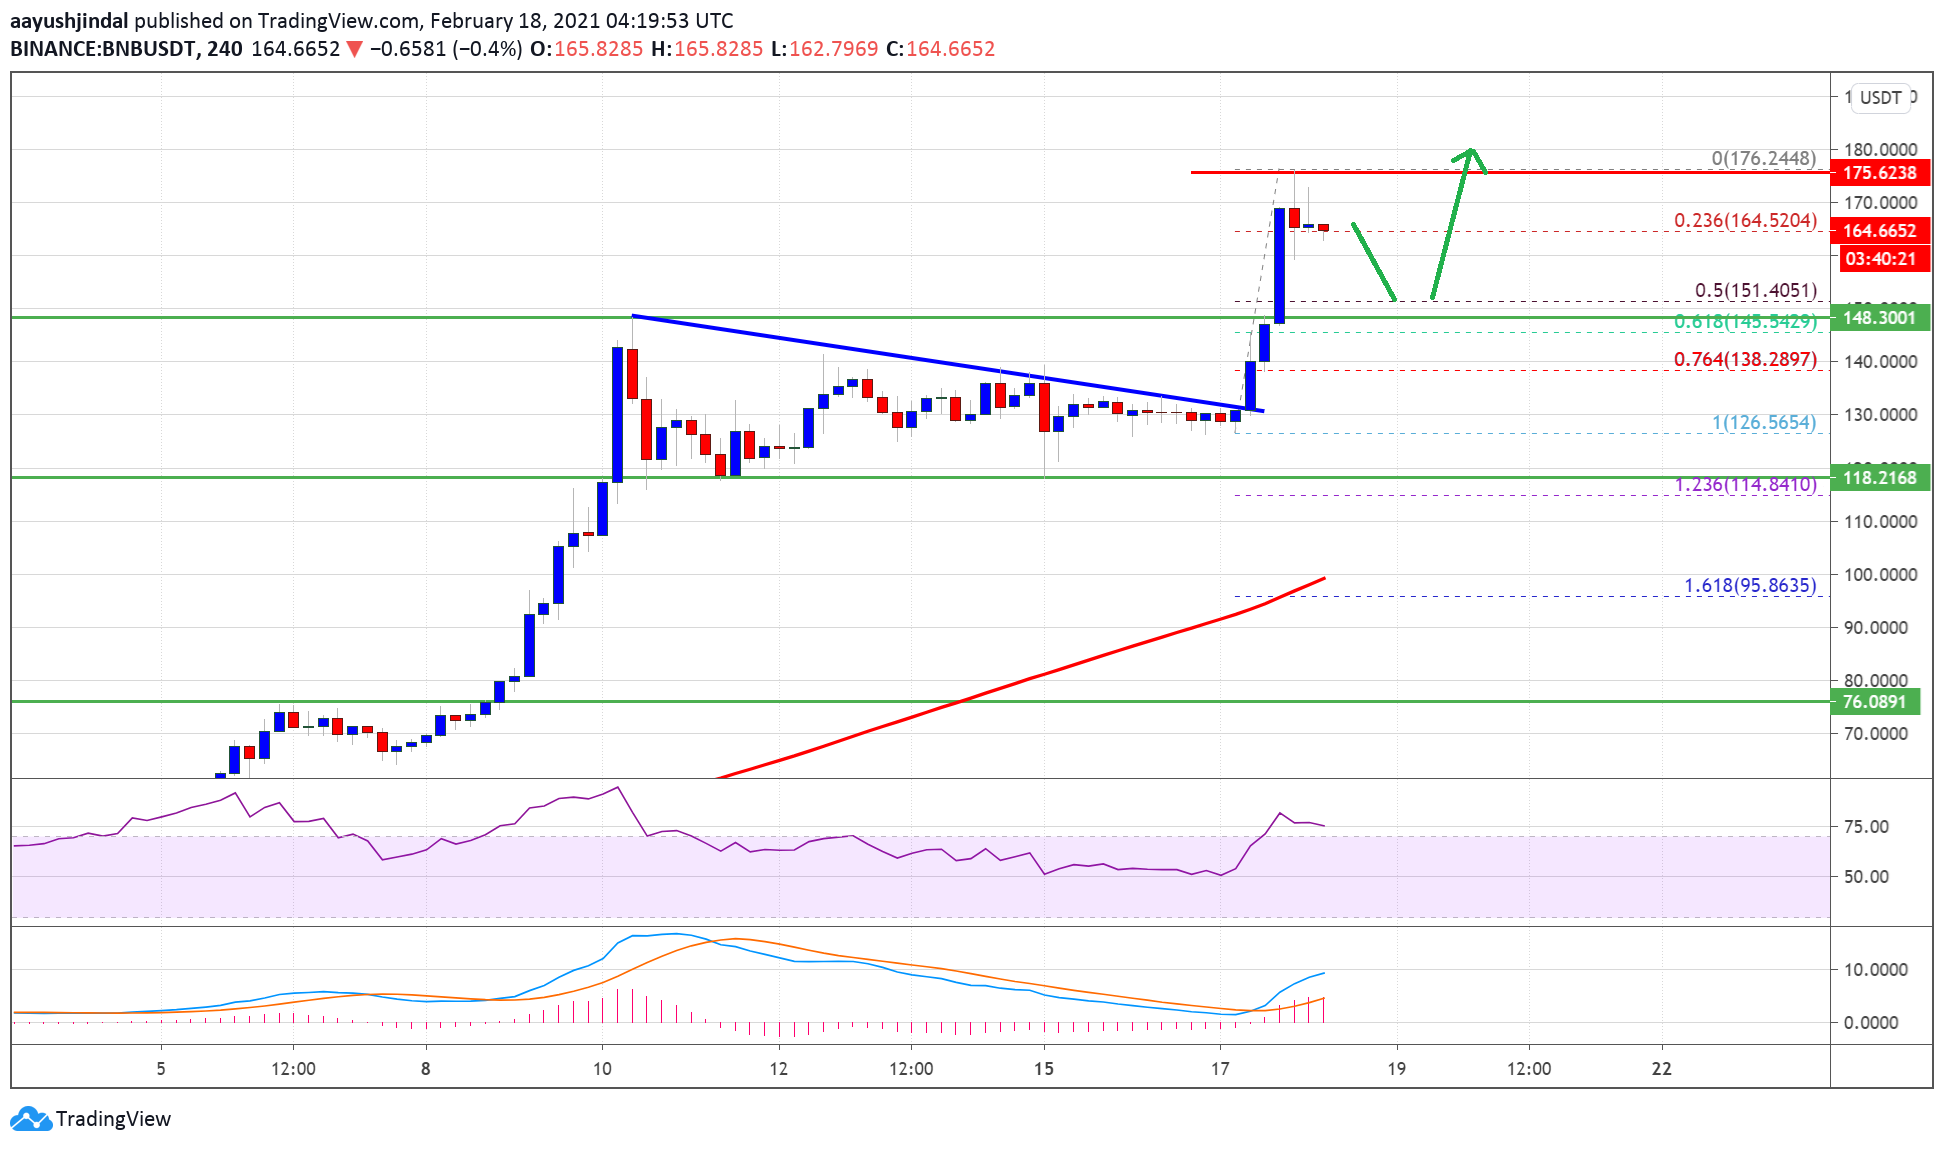
Binance coin price is up over 20% and it is outperforming bitcoin against the USDT. BNB rallied above $150 and traded to a new all-time high at $176.
- Binance coin price is gaining bullish momentum above the $150 level against the USDT.
- The price is up over 20% and it traded to a new all-time high near $176.
- There was a break above a major bearish trend line with resistance near $130 on the 4-hours chart of the BNB/USDT pair (data source from Binance).
- There could be a short-term downside correction, but the bulls are likely to protect $150.
Binance Coin Price Rallies 20%
In the past few days, bitcoin, Ethereum, and binance coin extended their gains. BNB price formed a support base above the $120 level and started another strong upward move.
The price cleared the $150 resistance level and settled well above the 100 simple moving average (4-hours). There was also a break above a major bearish trend line with resistance near $130 on the 4-hours chart of the BNB/USDT pair.
The pair rallied over 20% and it even spiked above the $175 level. A new all-time high is formed near $176 and the price is currently consolidating gains. It is testing the 23.6% Fib retracement level of the upward move from the $126 swing low to $176 high.
Source: BNBUSDT on TradingView.com
The next major support is near the $150 zone (the recent breakout zone). It is close to the 50% Fib retracement level of the upward move from the $126 swing low to $176 high.
Therefore, dips towards the $150 level could find a strong buying interest in the near term. Any more losses may possibly open the doors for a push towards the $125 support level.
More Upsides in BNB?
If BNB remains stable above $150, it could continue to rise. An initial resistance on the upside is near the $175 zone or the $176 high.
A clear break above $175 and $176 is likely to clear the path for another 10%-15% rally. In the stated case, the price is likely to hit the $200 level in the coming sessions.
Technical Indicators
4-Hours MACD – The MACD for BNB/USDT is gaining momentum in the bullish zone.
4-Hours RSI (Relative Strength Index) – The RSI for BNB/USDT is currently well in the overbought zone.
Major Support Levels – $160, $150 and $125.
Major Resistance Levels – $175, $180 and $200.
OhNoCrypto
via https://www.ohnocrypto.com
Aayush Jindal, @KhareemSudlow

