Charted: Binance Coin (BNB) Gains Momentum, Why Dips Are Attractive
" href="https://www.newsbtc.com/dictionary/coin/" >coin price found support near $200 and started a fresh increase against the USDT. BNB is gaining momentum and it seems like the bulls are eyeing a fresh increase above $300.
- Binance Coin
A coin is a unit of digital value. When describing cryptocurrencies, they are built using the bitcoin technology and have no other value unlike tokens which have the potential of software being built with them.» Read more
" href="https://www.newsbtc.com/dictionary/coin/" >coin price started a fresh increase above $220 and $230 against the USDT.
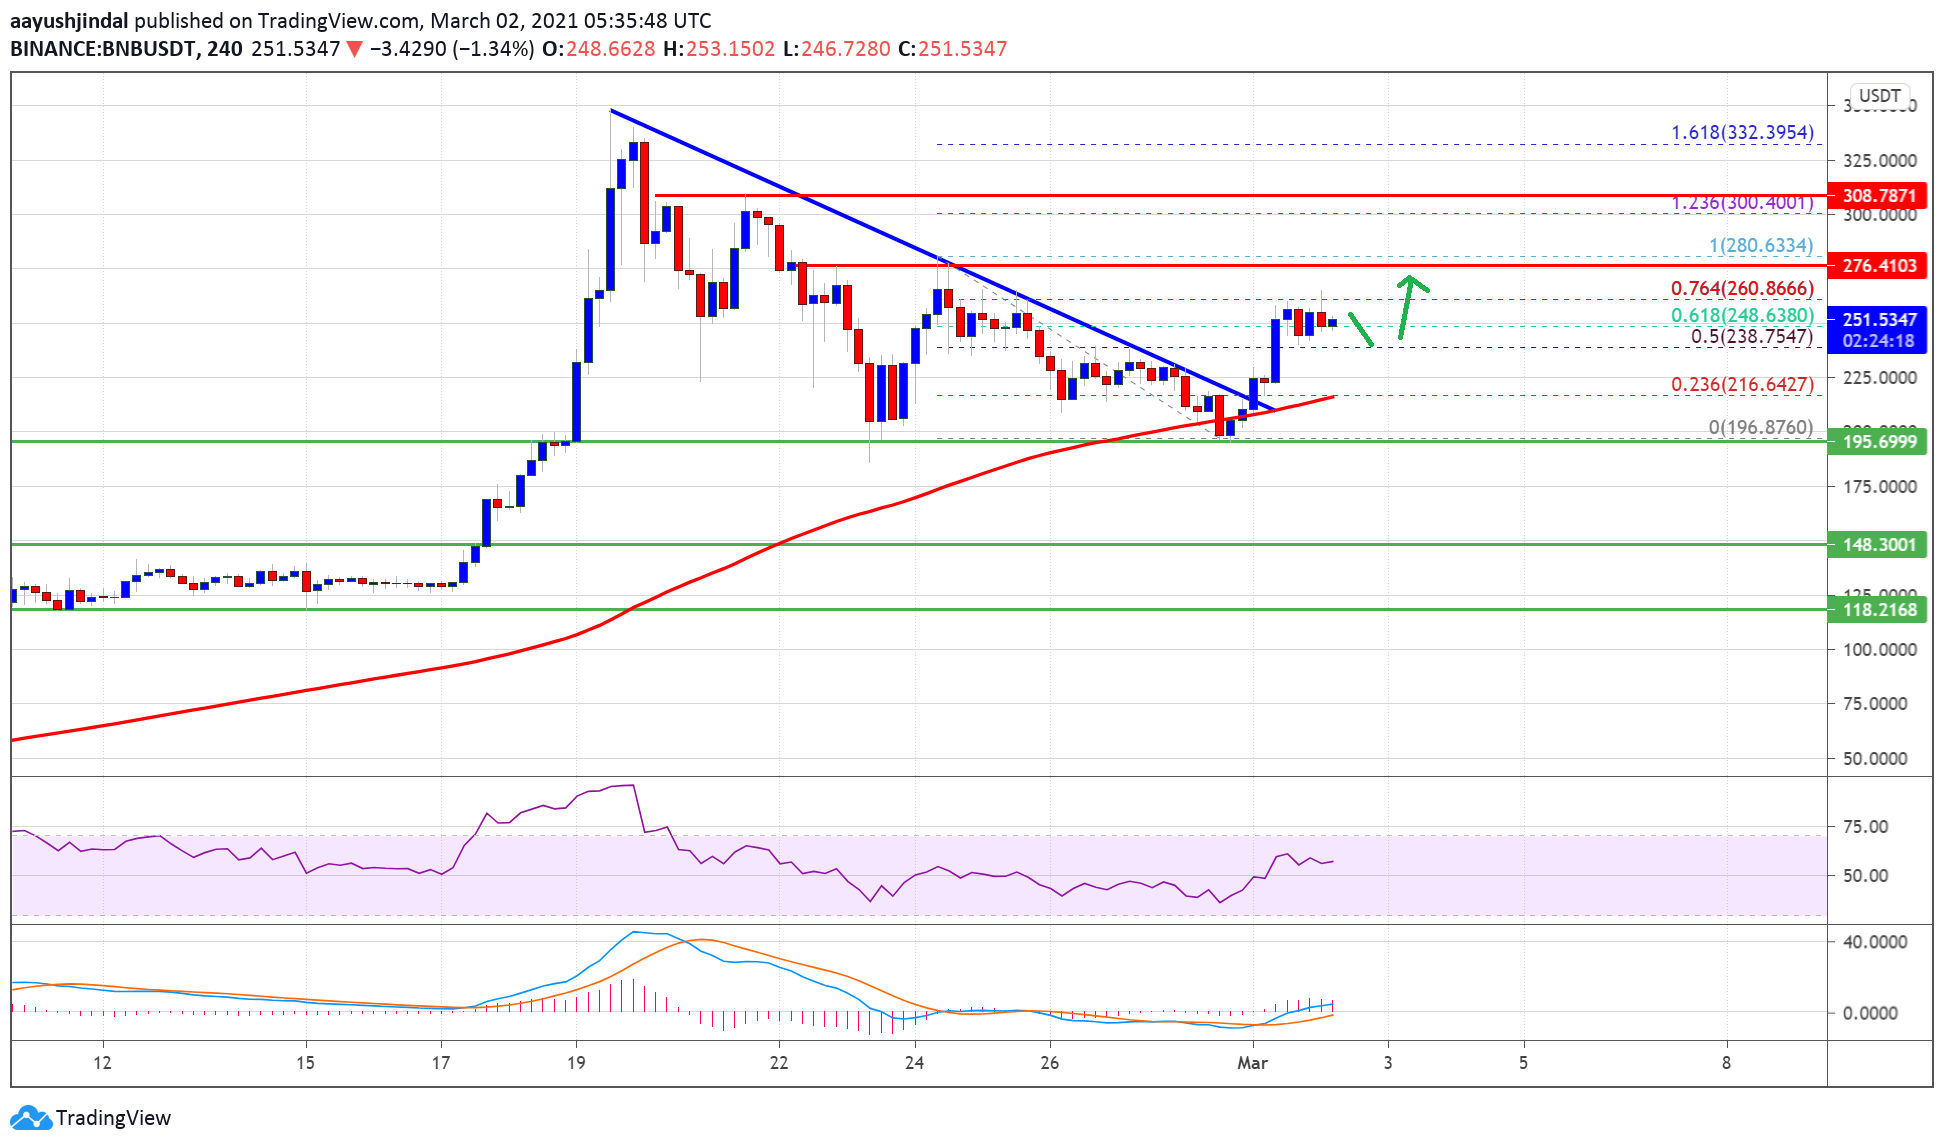
- The price is trading nicely above $250 and it is well above the 100 simple moving average (4-hours).
- There was a break above a major bearish trend line with resistance near $215 on the 4-hours chart of the BNB/USDT pair (data source from Binance).
- The pair is likely to continue higher above the $260 and $280 resistance levels in the near term.
Binance Coin
A coin is a unit of digital value. When describing cryptocurrencies, they are built using the bitcoin technology and have no other value unlike tokens which have the potential of software being built with them.
» Read more
" href="https://www.newsbtc.com/dictionary/coin/" >Coin Price Climbs above $250
After surging above $300, binance Coin
" href="https://www.newsbtc.com/dictionary/coin/" >coin started a downside correction. BNB declined over $100 and it even spiked below $200. The price traded as low as $196 and it remained stable above the 100 simple moving average (4-hours).
Recently, there was a fresh increase above the $210 and $220 resistance levels. There was also a break above a major bearish trend line with resistance near $215 on the 4-hours chart of the BNB/USDT pair.
Source: BNBUSDT on TradingView.com
The pair even surpassed the 50% Fib retracement level of the key downward move from the $280 swing high to $196 low. It is now trading nicely above $260, and outperformed bitcoin and ethereum. An immediate resistance is near the $260 level.
The 76.4% Fib retracement level of the key downward move from the $280 swing high to $196 low is acting as a resistance. The next major resistance is near the $275 level, above which the price could surge towards the $300 and $320 levels.
Dips Supported in BNB?
If BNB fails to continue higher above $260 and $280, there could be a fresh downside correction. The first major support is near the $238 level.
The next major support is near the $225 level. The main support is now forming near the $215 level and the 100 simple moving average (4-hours). A downside break below the $215 support could open the doors for a move below the $200 level.
Technical Indicators
4-Hours MACD – The MACD for BNB/USDT is gaining pace in the bullish zone.
4-Hours RSI (Relative Strength Index) – The RSI for BNB/USDT is currently well above the 50 level.
Major Support Levels – $238, $225 and $215.
Major Resistance Levels – $260, $280 and $300.
OhNoCrypto
via https://www.ohnocrypto.com
Aayush Jindal, @KhareemSudlow

