Why Bitcoin Price Could Accelerate To $65K, Dips Likely To Be Limited
Bitcoin price is gaining momentum and it broke the $60,000 resistance against the US Dollar. BTC is showing positive signs and it could continue to rise towards $65,000.
- Bitcoin rallied above the $60,000 level and traded to a new all-time high near $61,800.
- The price is now trading nicely above $60,000 and the 100 simple moving average (4-hours).
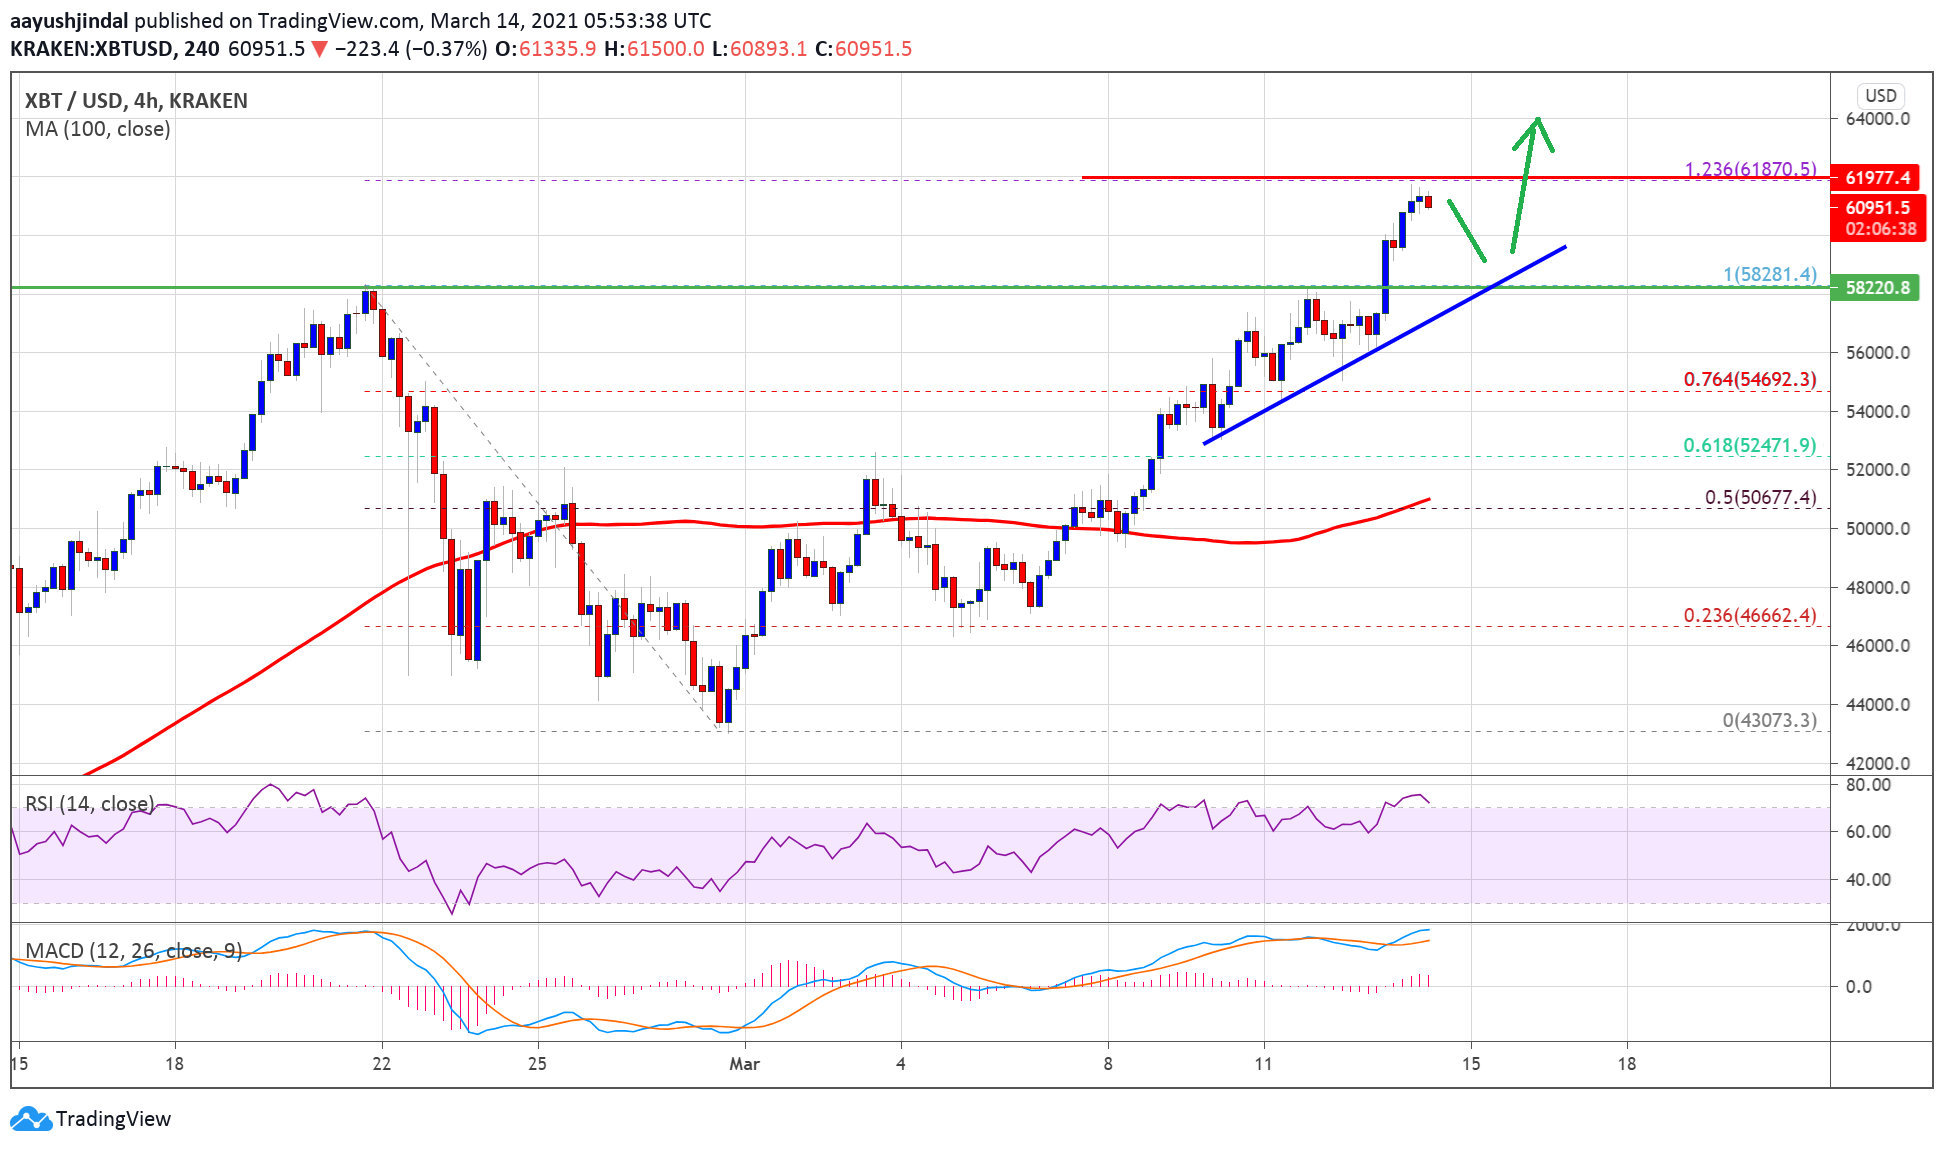
- There is a key bullish trend line forming with support near $58,500 on the 4-hours chart of the BTC/USD pair (data feed from Kraken).
- The pair could correct lower, but dips are likely to be limited below $58,000 in the near term.
Bitcoin Price is Surging
This past week, bitcoin price started a steady increase above the $55,000 resistance against the US Dollar. The BTC/USD pair even broke the $58,000 level and settled above the 100 simple moving average (4-hours).
The upward move gained pace above the 76.4% Fib retracement level of the key downward move from the $58,281 swing high to $40,073 low. There was a strong increase above the $58,500 and $60,000 resistance levels.
It even spiked above the $61,000 level and traded to a new all-time high near $61,800. It seems like bitcoin price faced a strong selling interest near the $61,800. The 1.236 Fib extension level of the key downward move from the $58,281 swing high to $40,073 low.
Source: BTCUSD on TradingView.com
The price is currently correcting lower below the $61,000 level. On the downside, an initial support is near the $60,000 level. There is also a key bullish trend line forming with support near $58,500 on the 4-hours chart of the BTC/USD pair. Any more losses could open the doors for a move towards the $58,000 and $57,200 support levels.
Limited Downsides in BTC?
On the upside, the $61,500 and $61,800 resistance levels are initial hurdles for the bulls. A clear break above $61,800 could open the doors for a move towards the $62,500 level.
The next major resistance is near the $65,000 level. Any more gain could push the price towards the $68,000 and $68,500 resistance levels in the near term.
Technical indicators
4 hours MACD – The MACD for BTC/USD is gaining bullish momentum in the bullish zone.
4 hours RSI (Relative Strength Index) – The RSI for BTC/USD is now well above the 50 level.
Major Support Level – $60,000
Major Resistance Level – $58,500
OhNoCrypto
via https://www.ohnocrypto.com
Aayush Jindal, @KhareemSudlow

