Polkadot Slumps After Forming a Bearish Double Top
Apr 10, 2021 at 09:38 //
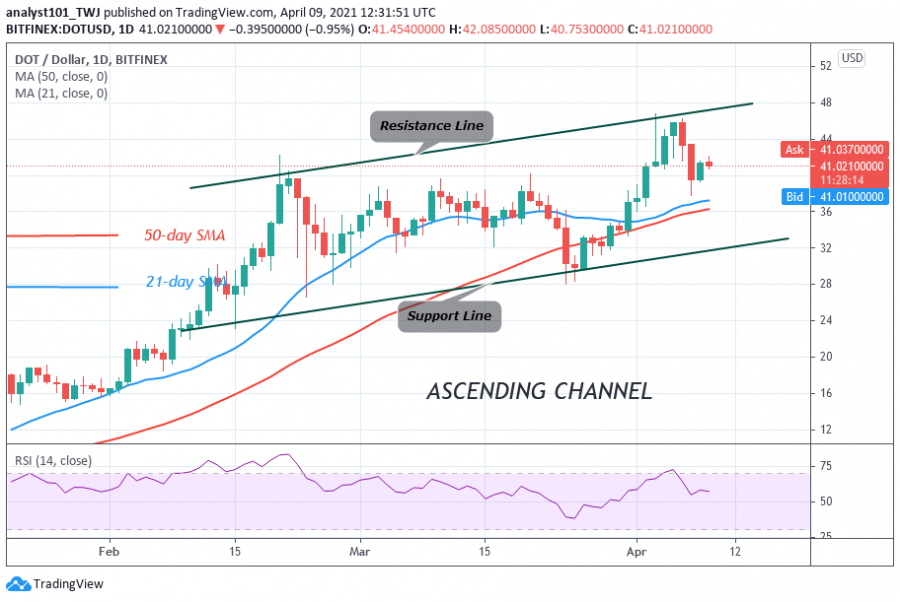
NewsDOT price is still in a downward correction after it was repelled twice at the $46 overhead resistance. The resistance at the overhead resistance caused the altcoin to decline to $38 low.
The price correction is facing an uphill task as the altcoin faces another rejection at the $42 high. Polkadot will decline again to $38 low if buyers fail to push DOTprice above $42 resistance.
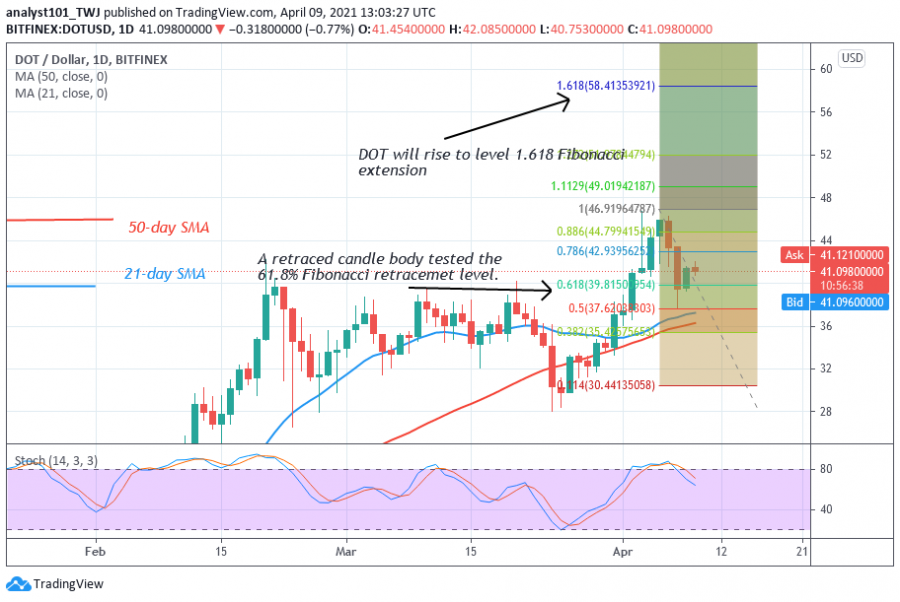
However, if buyers succeed in breaking the recent high, the market will rise to retest the overhead resistance at $46. Nevertheless, DOT/USD will resume an uptrend if price breaks the overhead resistance. The market will also rally to a $60 high. Meanwhile, Polkadot has resumed a downward move as it faces rejection at the $42 resistance.
Polkadot indicator analysis
The altcoins price is above the moving averages which suggest a further upward movement of price. The 21-day and 50-day SMAs are sloping northward indicating the uptrend. DOT is below the 80% range of the daily stochastic. It indicates that the market is in a bearish momentum.

Technical indicators:
Major Resistance Levels – $44 and $48
Major Support Levels – $24 and $20
What is the next direction for Polkadot?
The Polkadot uptrend was terminated at the $46 resistance. The altcoin has resumed a fresh uptrend which is facing another rejection at $42. The Fibonacci tool has indicated a possible upward movement of price. On April 4 uptrend; a retraced candle body tested the 61.8 % Fibonacci retracement. This retracement indicates that DOT will rise to level 1.618 Fibonacci extension or a high of $58.41.

Disclaimer. This analysis and forecast are the personal opinions of the author are not a recommendation to buy or sell cryptocurrency and should not be viewed as an endorsement by CoinIdol. Readers should do their research before investing funds.
OhNoCryptocurrency via https://www.ohnocrypto.com/ @coinidol.com By Coin Idol, @Khareem Sudlow
