Bitcoin Price Analysis: Amid Rumors of Approval of Futures-Backed ETF, Can BTC Overcome $60K?
BTC continues to show strong momentum despite elevated open interest and funding rates, a near-term cautious signal.
It appears the anticipation of a futures-backed BTC ETF has fueled the rally towards $60k.
After making a strong weekly close above $52.9k, suggesting the bear trap has completed, BTC continued pushing higher into the anticipated resistance zone between $55k to $58.3k. As we outlined in the past, the $55k to $58.3k resistance zone has heavy technical and on-chain resistance making it likely to see near-term selling pressure.

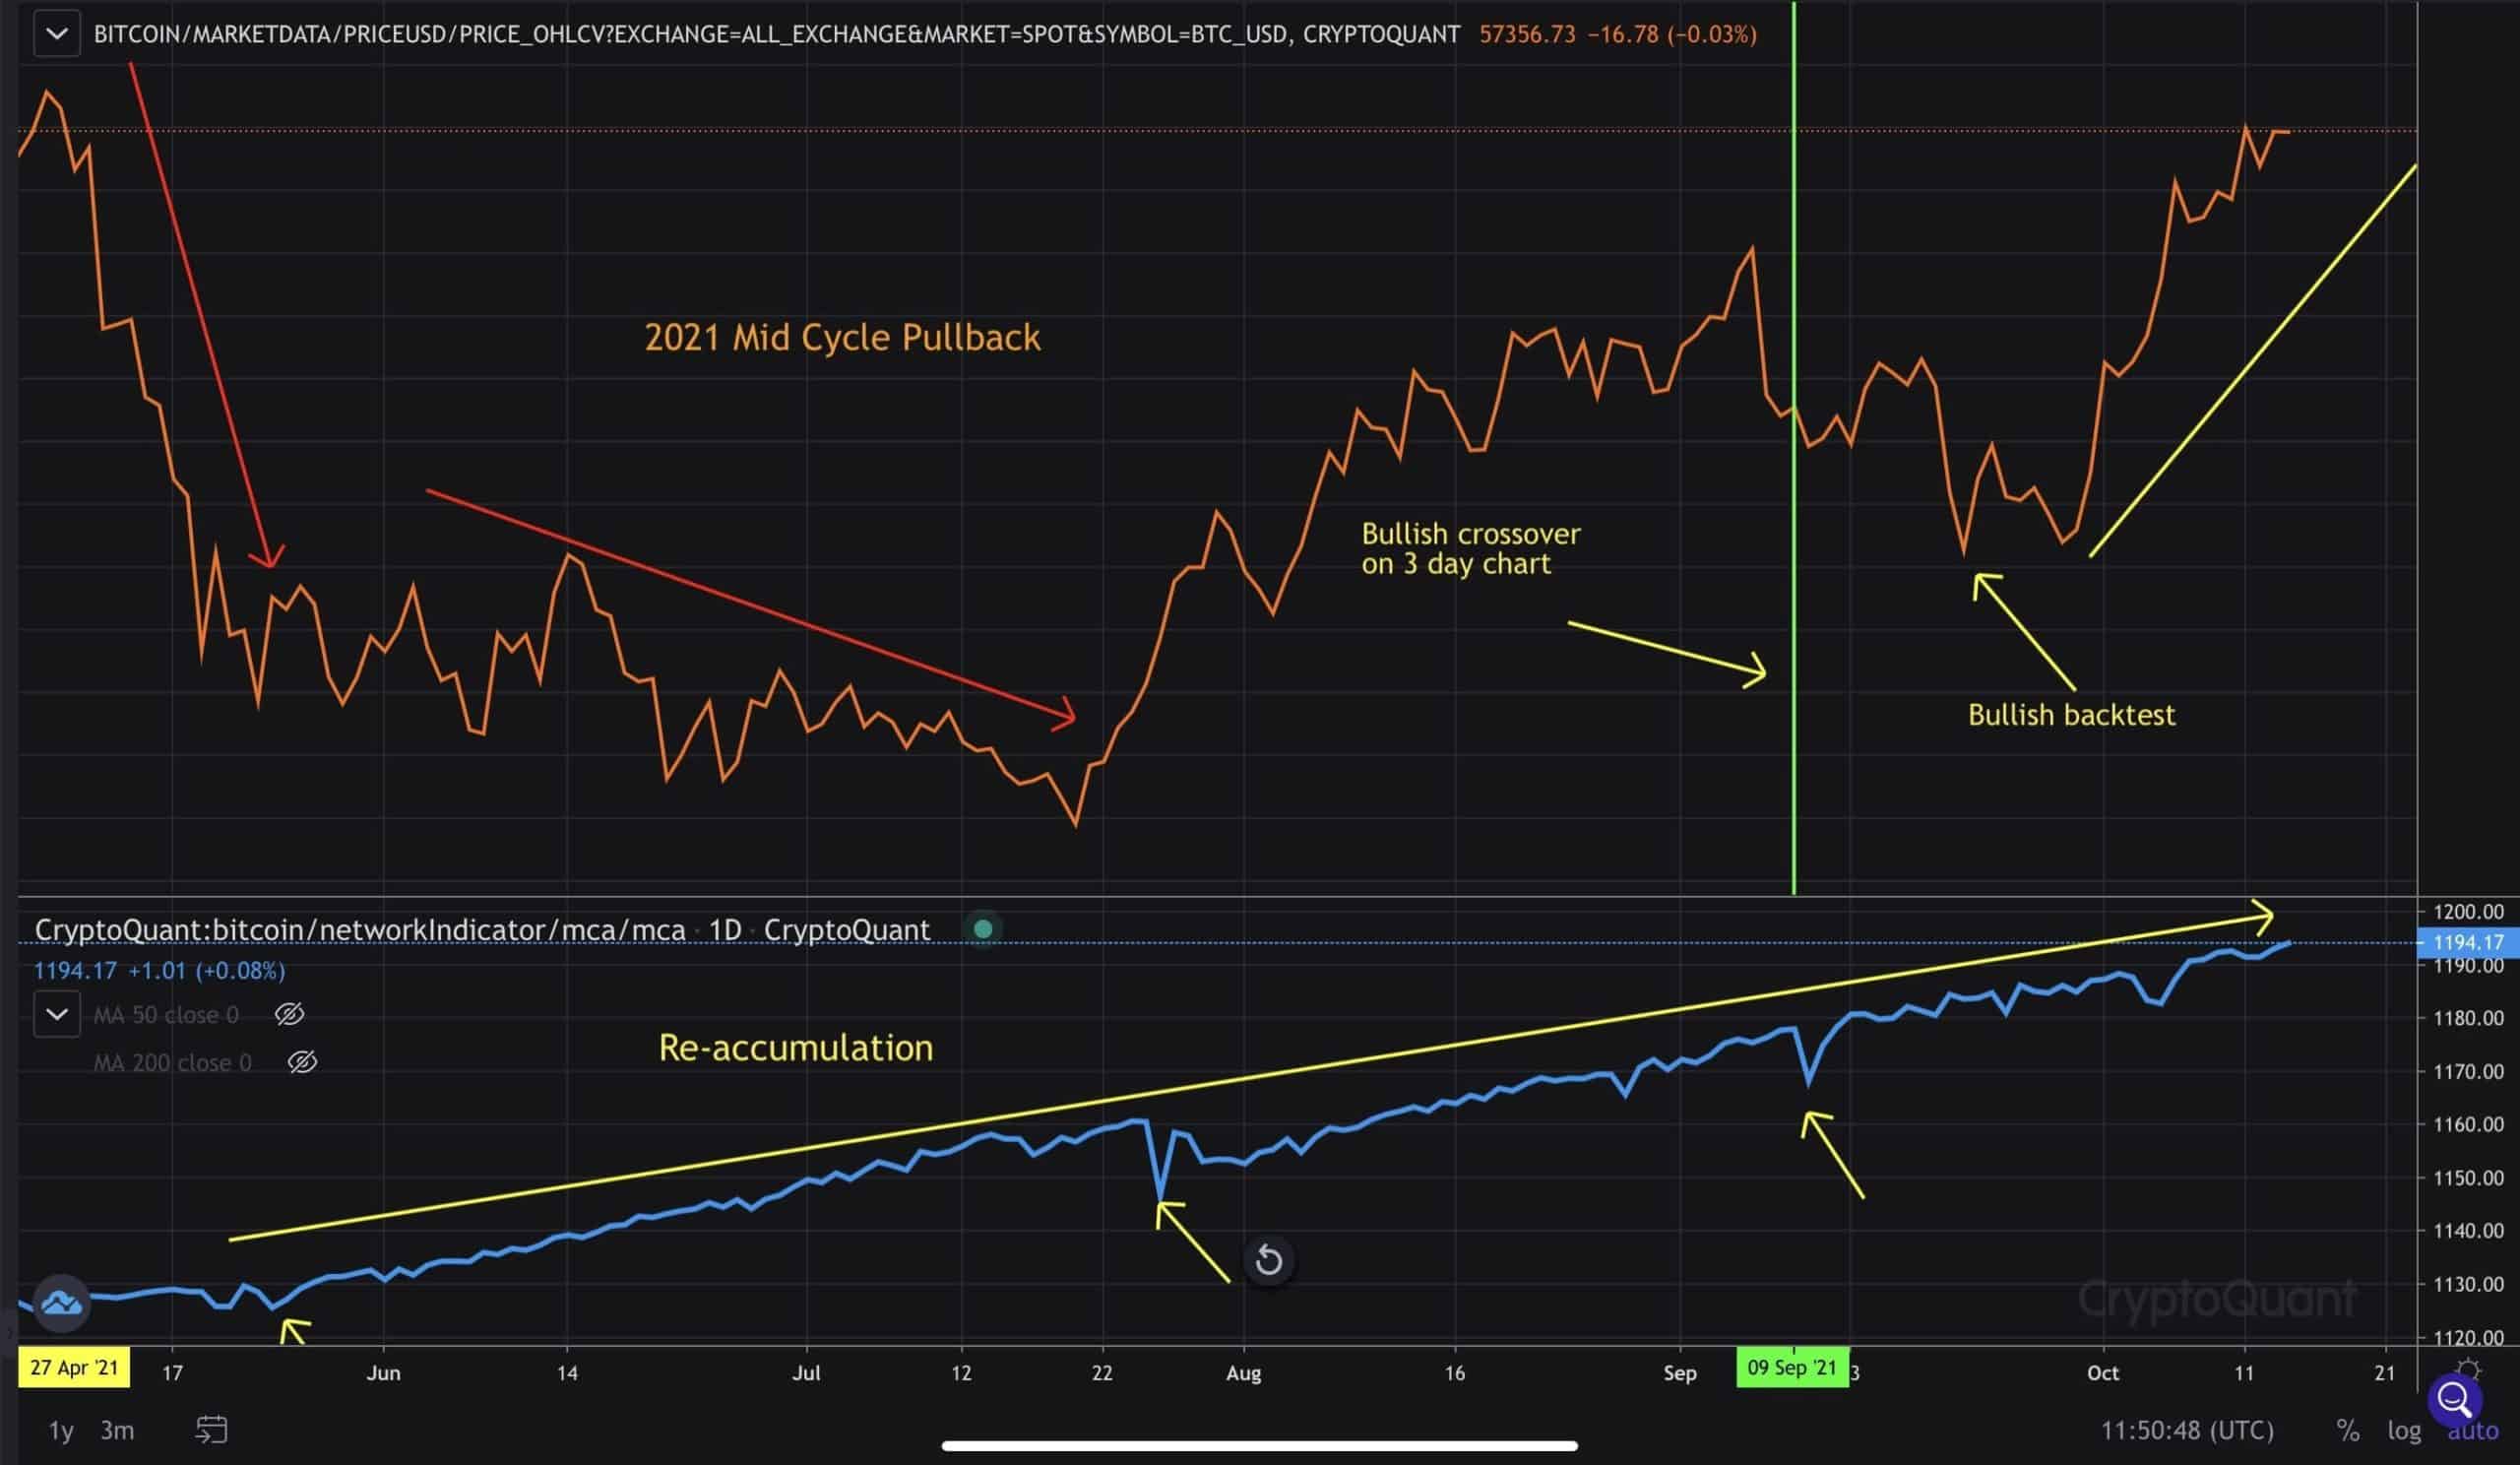
Technical momentum shows strength on the 3-day and weekly charts, signaling upside in the coming weeks and months. The September pullback turned daily momentum bearish, but the recent rally managed to flip it back to bullish again as BTC continues to test major resistance.
On-Chain Showing No Aggressive Distribution
During Bitcoin’s consolidation in the mid $50k levels, on-chain metrics showed light distribution from long-term holders, making no impact on the overall bullish trend of accumulation. As BTC pushed deeper into the upper $50k levels, spot inflows started to increase, causing spot exchange reserves to slowly trend higher.
The UTXO Age Distribution metric by CryptoQuant showed light distribution from some long-term holders but very low amounts compared to heavier distribution from later phases of bull markets. Long-term holders tend to distribute more aggressively as BTC pushes significantly higher in the later parts of bull markets. This indicates that they are not interested in selling BTC now, even with prices testing major resistance.
The Mean Coin Age, an on-chain metric that helps identify the trend of distribution or re-accumulation, has cooled off for two days from light distribution and has now resumed the nearly 5-month long uptrend, making new all-time highs. This shows long-term holders were not aggressively distributing, especially compared to bull traps, where they heavily distribute during recovery rallies.

SPX Showing Signs of Risk On Resuming
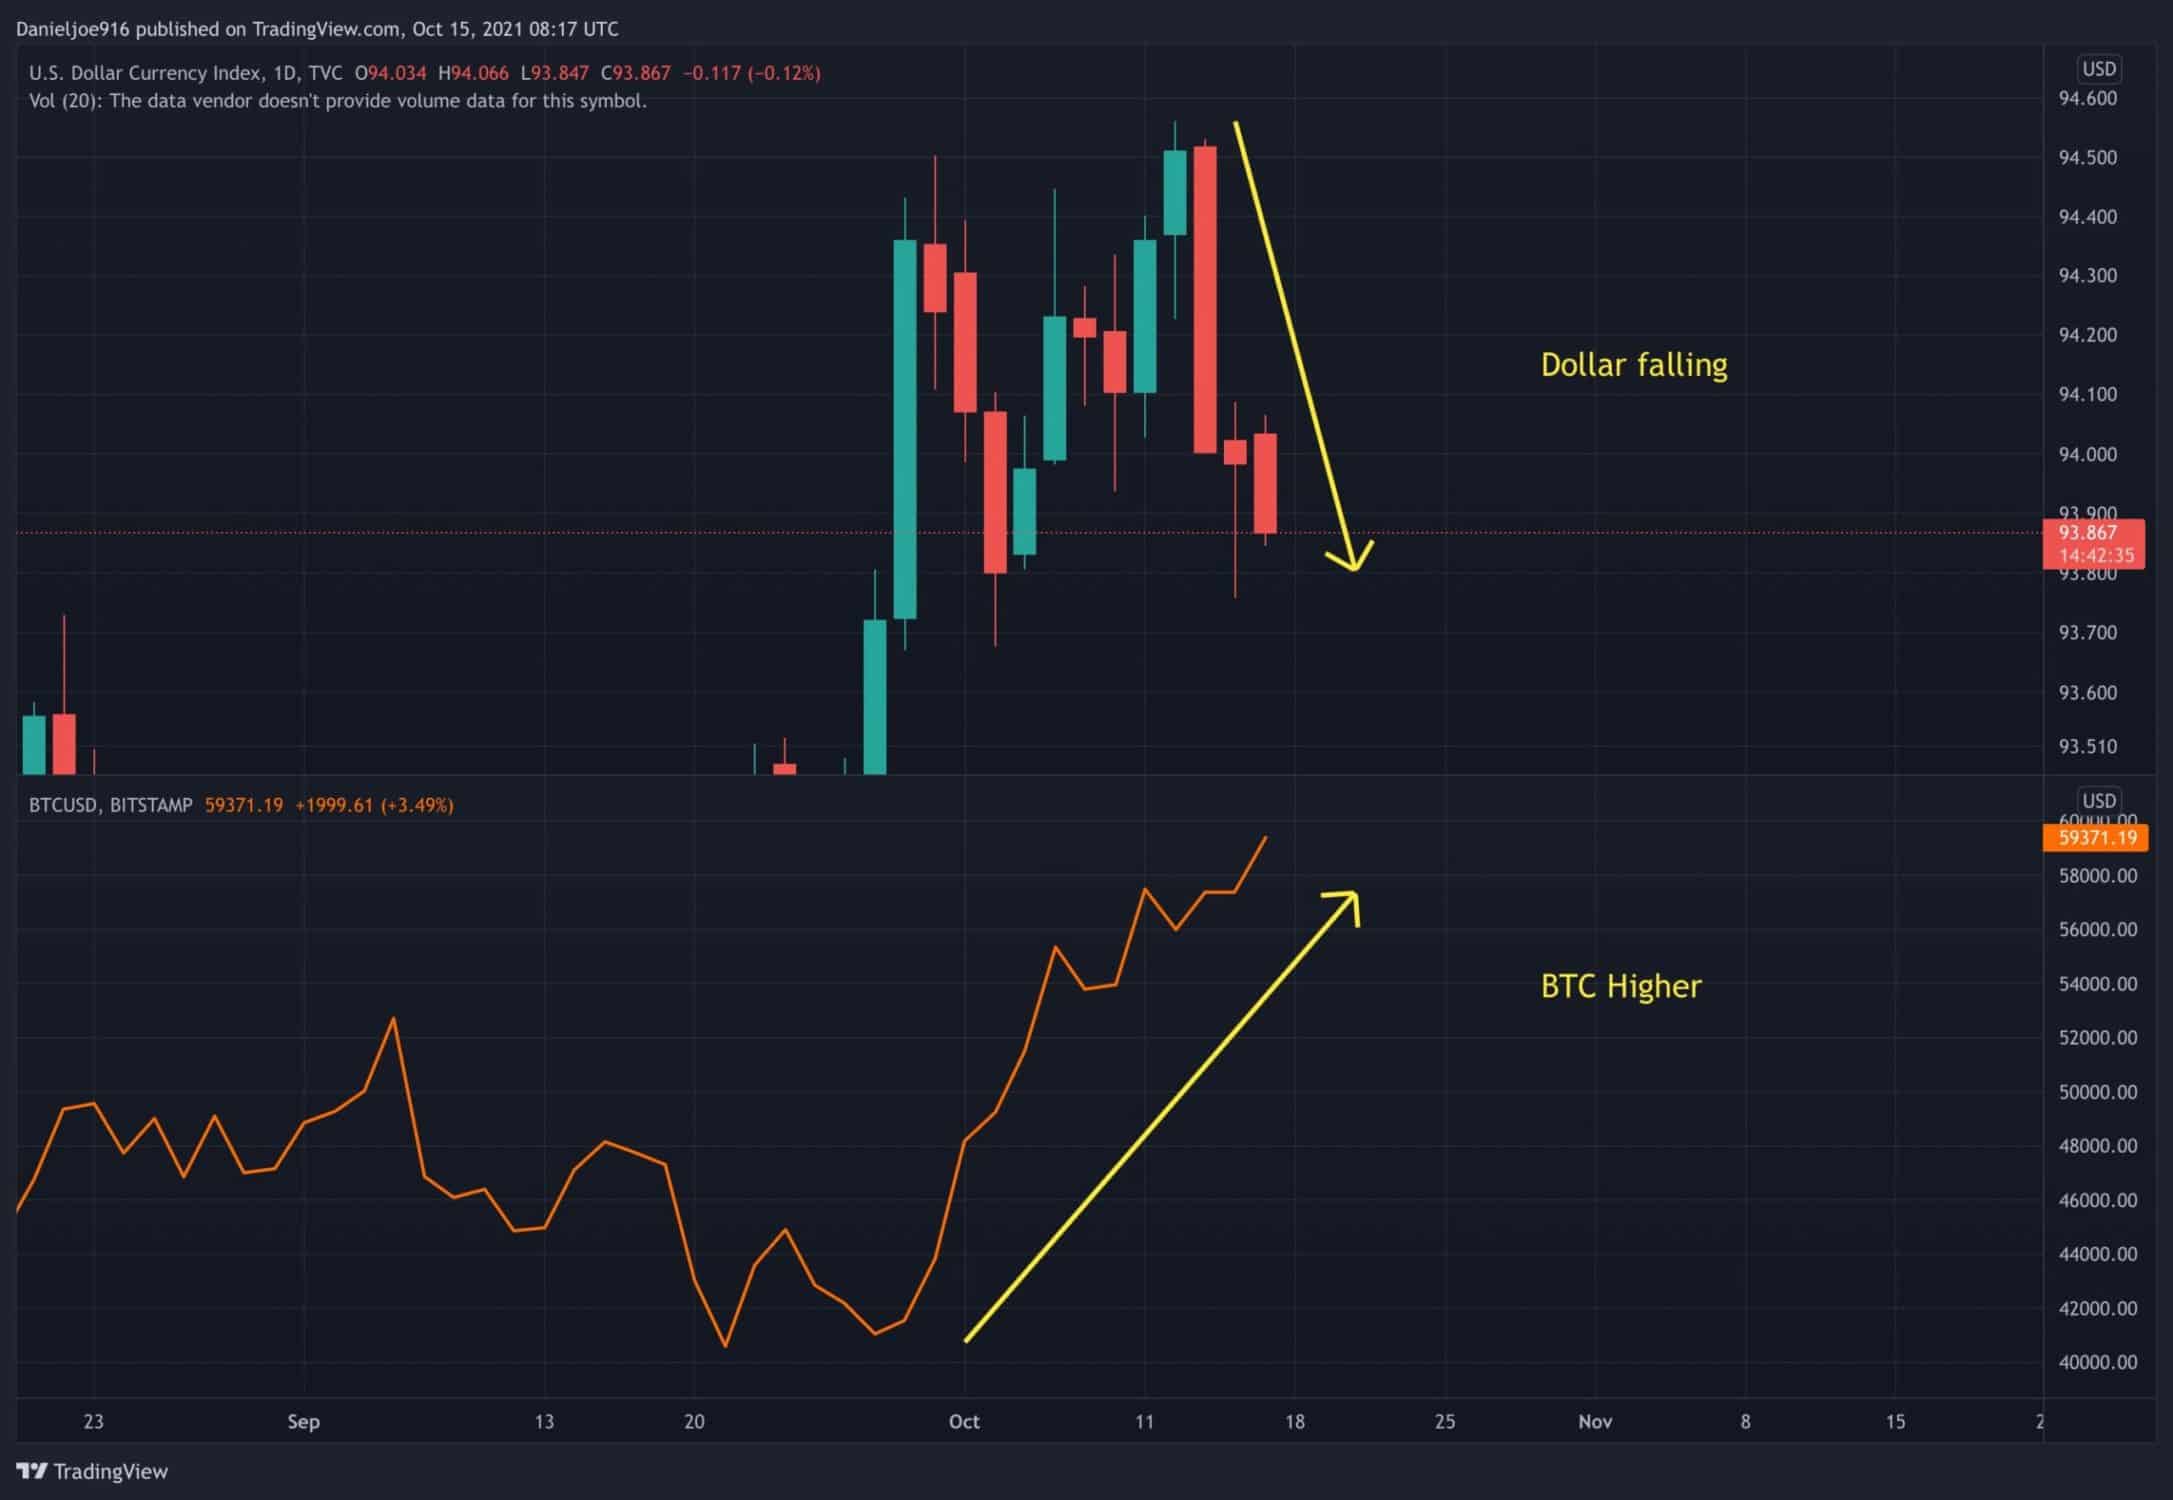
After a sharp drawdown in the SPX, the price managed to form a double bottom with bullish divergence on the 4-hour chart. In the last week, the SPX has been forming higher highs and higher lows, further validating a bottom. During the bottoming process, the dollar topped out near a technical resistance level and printed a bearish engulfing candle, indicating further downside, a bullish signal for risk assets.
Additionally, money continues to flow out of longer-term bonds, which usually signals investors are rotating back into stocks or other risk assets. This is important to watch because the macro conditions can also impact how BTC moves. Overall, a return to risk on is a positive catalyst for BTC as investors look for places to store their wealth.


Looking mid to long term, there are currently many positive catalysts for BTC in addition to bullish fundamental and on-chain data such as a potential BTC ETF approval, earnings season where companies could be announcing BTC purchases, and yet no signs of FOMO in the market.
It’s important to keep in mind that the BTC price could fall on the day of the announcement as the market sells the news. With elevated open interest, funding rates, and a large rally in the last few weeks, the risk of a near-term pullback should not be ignored. It’s highly likely for BTC to see a bullish continuation after a potential shake-out, as the overall trend remains firmly bullish.
OhNoRipple via https://www.ohnocrypto.com/ @Daniel Joe, @Khareem Sudlow
