Litecoin Is in a Brief Uptrend, Unable to Sustain Above $190 Overhead Resistance
Oct 19, 2021 at 11:40 //
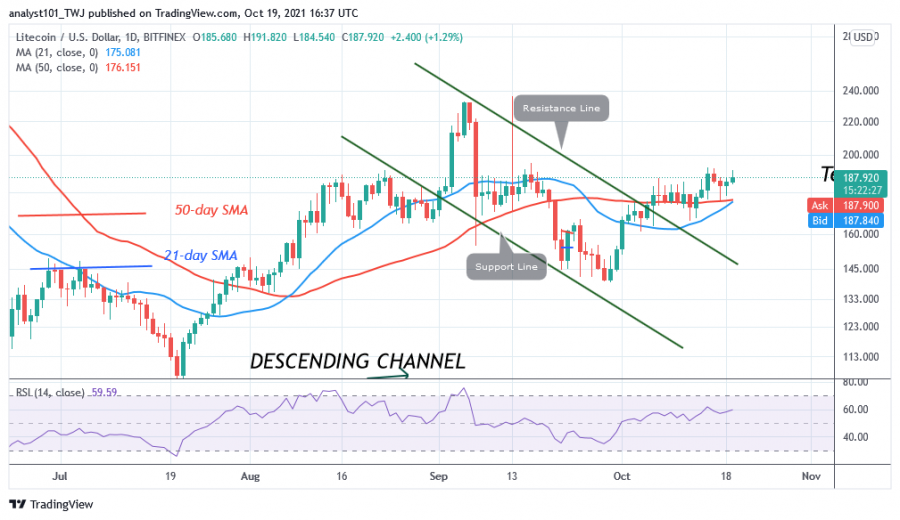
NewsThe price of Litecoin (LTC) trades above the moving average. Today, buyers are retesting resistance at $190 as the cryptocurrency drops to $188. The LTC price has been stuck below the $190 resistance zone.
The bulls have failed to break through this resistance since August 16. The bulls have also been beaten back at this resistance three times in the last four days. An upside breakout above resistance would catapult the altcoin to a high of $220. The bullish momentum will extend to the high of $230. On the other hand, if the bulls fail to break above resistance, Litecoin will dip back into a trading range below resistance.
Litecoin indicator analysis
Litecoin has risen to the 60 level on the Relative Strength Index for period 14. This indicates that Litecoin is in a bullish trend zone, capable of rallying to the upside. The price of the cryptocurrency is above the moving averages, which ensure further upward movement of the cryptocurrency. Litecoin is above 80% of the daily stochastic. This indicates that the market has reached an overbought zone and sellers are emerging.

Technical Indicators
Resistance Levels: $200, $220, $240
Support Levels: $160, $140, $120
What is the next move for Litecoin?
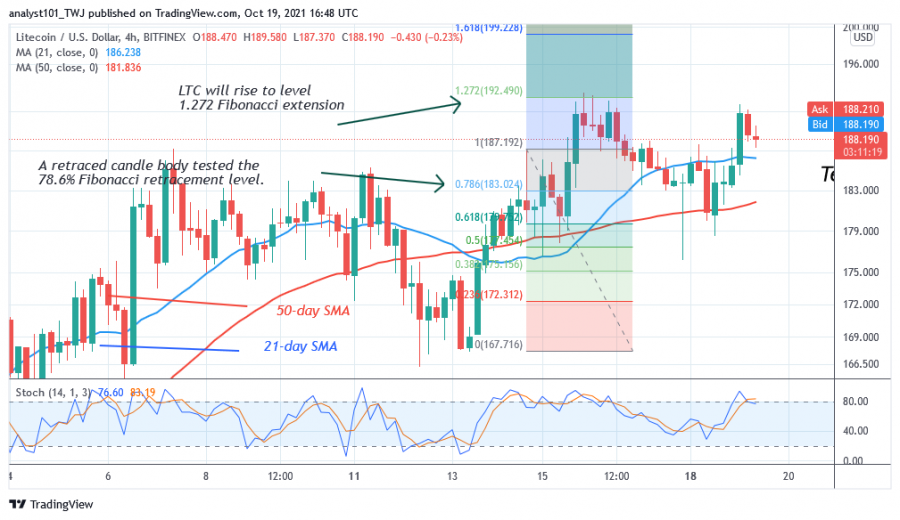
On the 4-hour chart, Litecoin is in a short uptrend. The uptrend is encountering resistance at $190. Meanwhile, the uptrend from October 14 has a candle body testing the 61.8% Fibonacci retracement level. The retracement suggests LTC will rise but reverse at 1.272 Fibonacci extensions or at $192.

Disclaimer. This analysis and forecast are the personal opinions of the author and are not a recommendation to buy or sell cryptocurrency and should not be viewed as an endorsement by CoinIdol. Readers should do their own research before investing funds.
OhNoCryptocurrency via https://www.ohnocrypto.com/ @coinidol.com By Coin Idol, @Khareem Sudlow
