Bitcoin Trades Marginally, Fluctuates Between $56,000 and $58,400
Nov 25, 2021 at 10:18 //
NewsThe price of Bitcoin (BTC) is falling again after meeting rejection at the high of $58,400. Buyers are desperately trying to end the current downward correction.
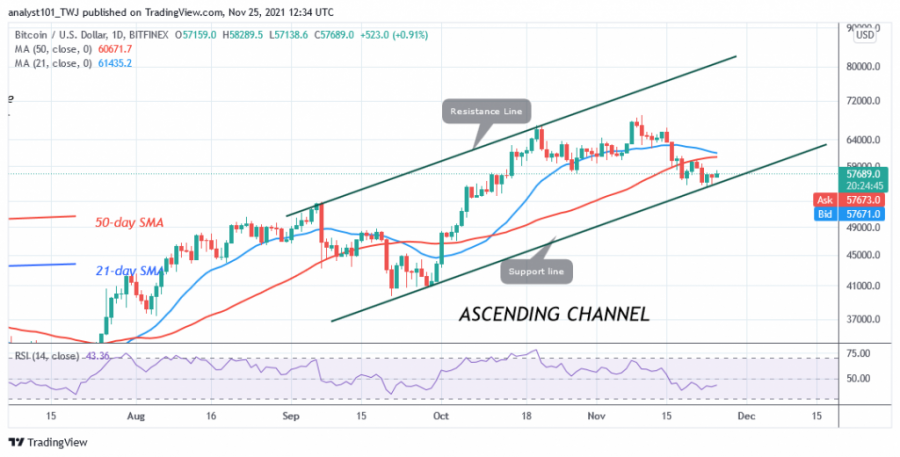
The recent downturn has eased as Bitcoin has found support above $55,700. Since November 22, BTC/USD has been trading in a tight range between $56,000 and $58,400. On November 23 and today, buyers attempted to push the BTC price above the $58,400 high but were rejected.
Bitcoin would have risen to the $60,000 price level if buyers had been successful above current resistance. If the market declines, it could return to the lower price area above $56,000. As usual, the bulls will buy the dips if the price falls below the lower price range. However, if the bears break through support at $55,700 and the bearish momentum continues, bitcoin will fall to a low of $51,050. In the meantime, the BTC price will fluctuate between the $56,000 and $58,400 levels.
Bitcoin indicator reading
Bitcoin has fallen to level 41 on the Relative Strength Index for period 14. The price of BTC is still in a downward correction and may continue to fall. The price of the cryptocurrency is below the 50-day line and the 21-day line of the moving averages that determine the downward movement. The bitcoin price is still below the 80% area of the daily stochastic. The cryptocurrency is in a bearish momentum.

Technical indicators:
Major Resistance Levels - $65,000 and $70,000
Major Support Levels - $60,000 and $55,000
What is the next direction for BTC?
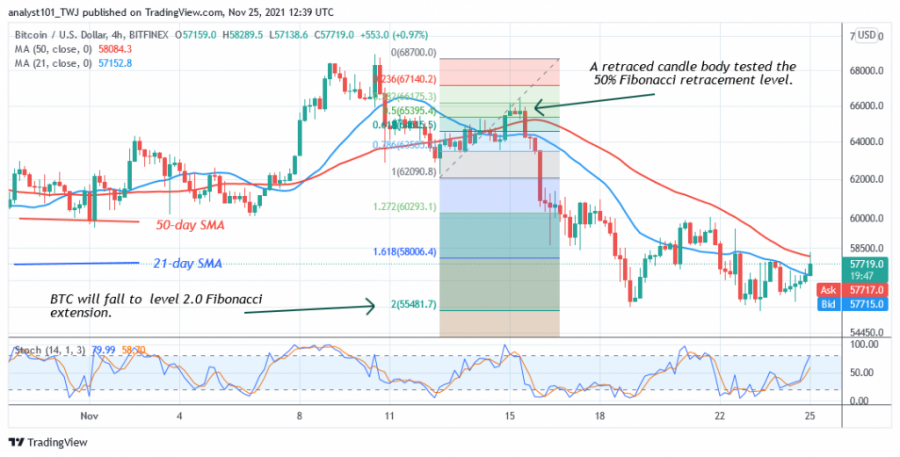
On the 4-hour chart, the price of BTC has been in a downtrend. The market has reached bearish exhaustion. Bitcoin is now trading in a limited range as the market resumes its downward movement. Meanwhile, on November 12, the downtrend tested the 50% Fibonacci retracement level through a candlestick. The retracement suggests that the BTC price will fall to the 2.0 level of the Fibonacci extension or $55,581.

Disclaimer. This analysis and forecast are the personal opinions of the author and are not a recommendation to buy or sell cryptocurrency and should not be viewed as an endorsement by CoinIdol. Readers should do their own research before investing funds.
OhNoCryptocurrency via https://www.ohnocrypto.com/ @coinidol.com By Coin Idol, @Khareem Sudlow
