Polkadot Hovers above $26 as the Altcoin Reaches an Oversold Region
Dec 11, 2021 at 10:58 //
NewsPolkadot (DOT) is in a downtrend as the price has reached the oversold region at $26. The current downturn has reached bearish exhaustion.
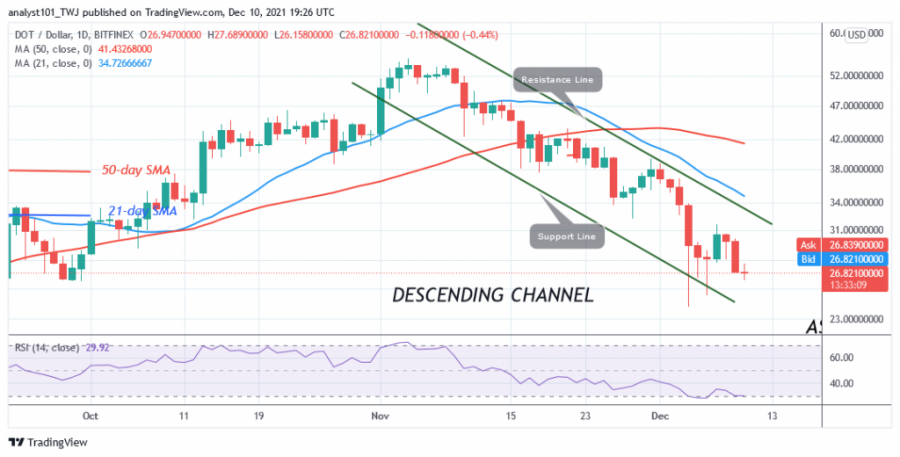
There was a bearish impulse on December 4. The cryptocurrency plunged to a low of $23.95 as the bulls bought the dips. DOT/USD is likely to reverse at the current support. The tail of the long candlestick is already pointing to an upward price move. The long candlestick tail indicates that the lower price levels are exerting strong buying pressure. Meanwhile, DOT/USD is trading at $26.78 at the time of writing.
Polkadot indicator analysis
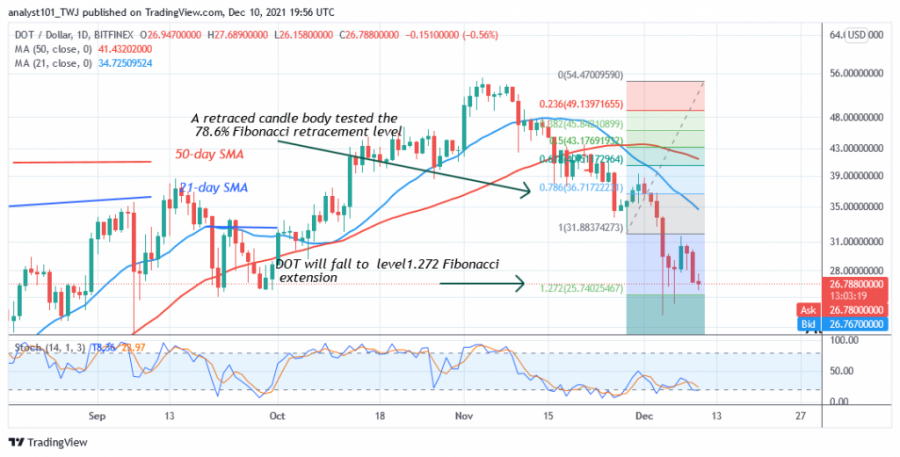
The Polkadot indicator is at level 29 of the Relative Strength Index for period 14, indicating that the DOT price has reached the oversold area of the market. Buyers are expected to emerge to push the prices up. The cryptocurrency price is below the 28% area of the daily stochastic. The market is in a bearish momentum. The bearish momentum is volatile.

Technical indicators:
Major Resistance Levels - $52 and $56
Major Support Levels - $28 and $24
What is the next direction for Polkadot?
On the 4-hour chart, Polkadot is in a downtrend. The price of DOT is moving above $26 support as the market approaches the oversold region. Meanwhile, on November 28, the downtrend started by a candlestick testing the 78.6% Fibonacci retracement level. The retracement suggests that DOT will fall but reverse at the 1.272 Fibonacci extension level or $25.74.

Disclaimer. This analysis and forecast are the personal opinions of the author and are not a recommendation to buy or sell cryptocurrency and should not be viewed as an endorsement by CoinIdol. Readers should do their research before investing funds.
OhNoCryptocurrency via https://www.ohnocrypto.com/ @coinidol.com By Coin Idol, @Khareem Sudlow
