Polkadot Hovers above $18 Support as Buyers Fail to Breach the $23 High
Feb 19, 2022 at 11:31 //
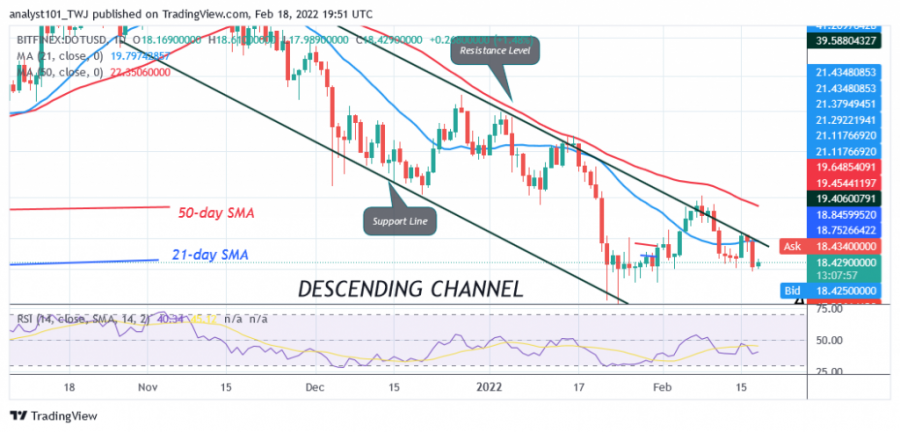
PriceThe price of Polkadot (DOT) resumed its downward correction after the price fell below the moving averages. Today, the DOT price fell to the low of $17.
The cryptocurrency is in a downward correction as the altcoin falls into the $16 to $20 range. In the previous uptrend, buyers were unable to overcome resistance at $23 and the 50 moving average. This is the reason for the current downtrend.
Today there is a bullish candle above the $17 support, while altcoin continues its uptrend. DOT/USD is trading at $18.42 as of press time. If the DOT price rises above the current support, the $20 and $23 resistance levels are likely to be breached. The bullish momentum is likely to continue above the moving averages. Nevertheless, the downside correction will continue if the bullish scenario is invalidated.
Polkadot indicator analysis
DOT price is at the bottom of the chart and below the moving averages, indicating a possible downward movement. The cryptocurrency is at the 40 level of the Relative Strength Index for the period 14. The altcoin is trading in the downtrend zone and below the center line 50. The Polkadot is above the 25% area of the daily stochastic. The market is in a bullish momentum.

Technical indicators:
Major Resistance Levels - $52 and $56
Major Support Levels - $28 and $24
What is the next direction for Polkadot?
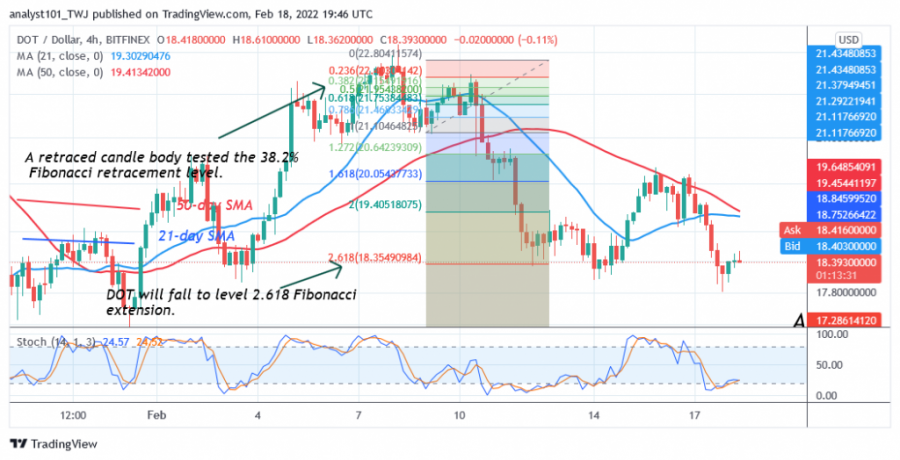
On the 4-hour chart, Polkadot is in a downward movement after rejecting the high at $23. Meanwhile, on February 8, the downtrend has seen a retracement candlestick testing the 38.2% Fibonacci retracement level. The retracement suggests that DOT will fall to the 2.618 Fibonacci Extension level or $18.35. The price action shows that DOT is moving above the 2.618 Fibonacci extension.

Disclaimer. This analysis and forecast are the personal opinions of the author and are not a recommendation to buy or sell cryptocurrency and should not be viewed as an endorsement by CoinIdol. Readers should do their research before investing funds.
OhNoCryptocurrency via https://www.ohnocrypto.com/ @coinidol.com By Coin Idol, @Khareem Sudlow
