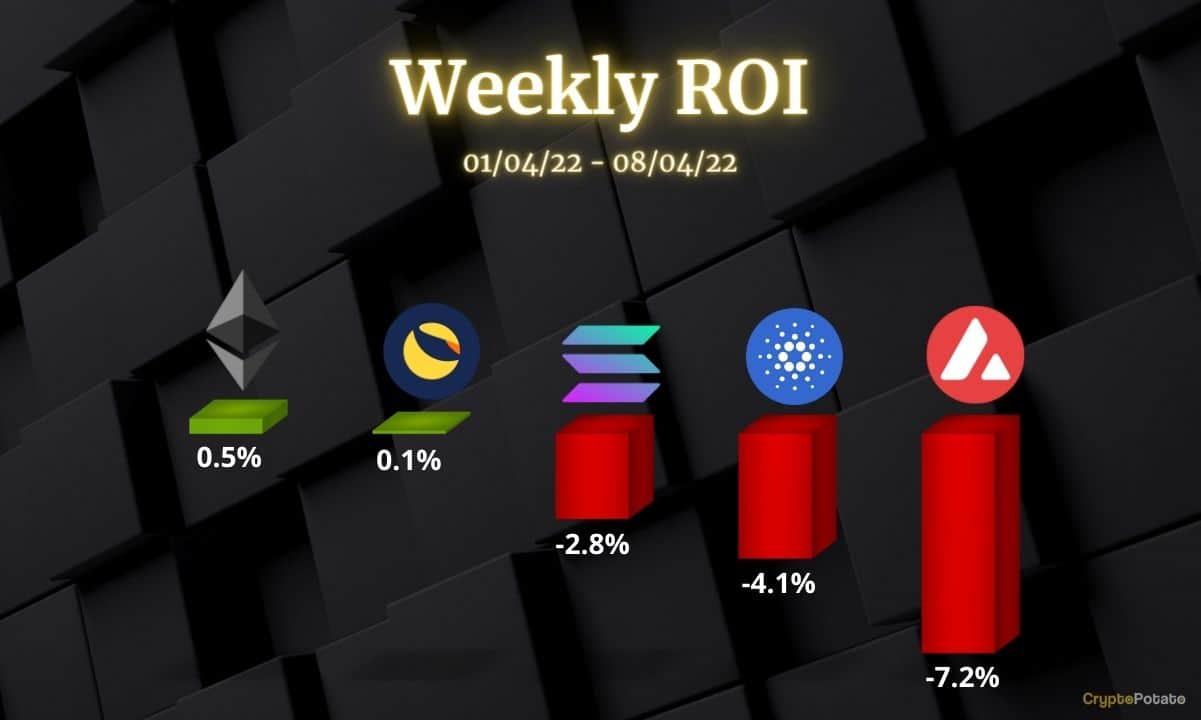
Crypto Price Analysis April-8: Ethereum, Cardano, Solana, Avalanche, and Luna
This week, we take a closer look at Ethereum, Cardano, Solana, Avalanche, and Luna
Ethereum (ETH)
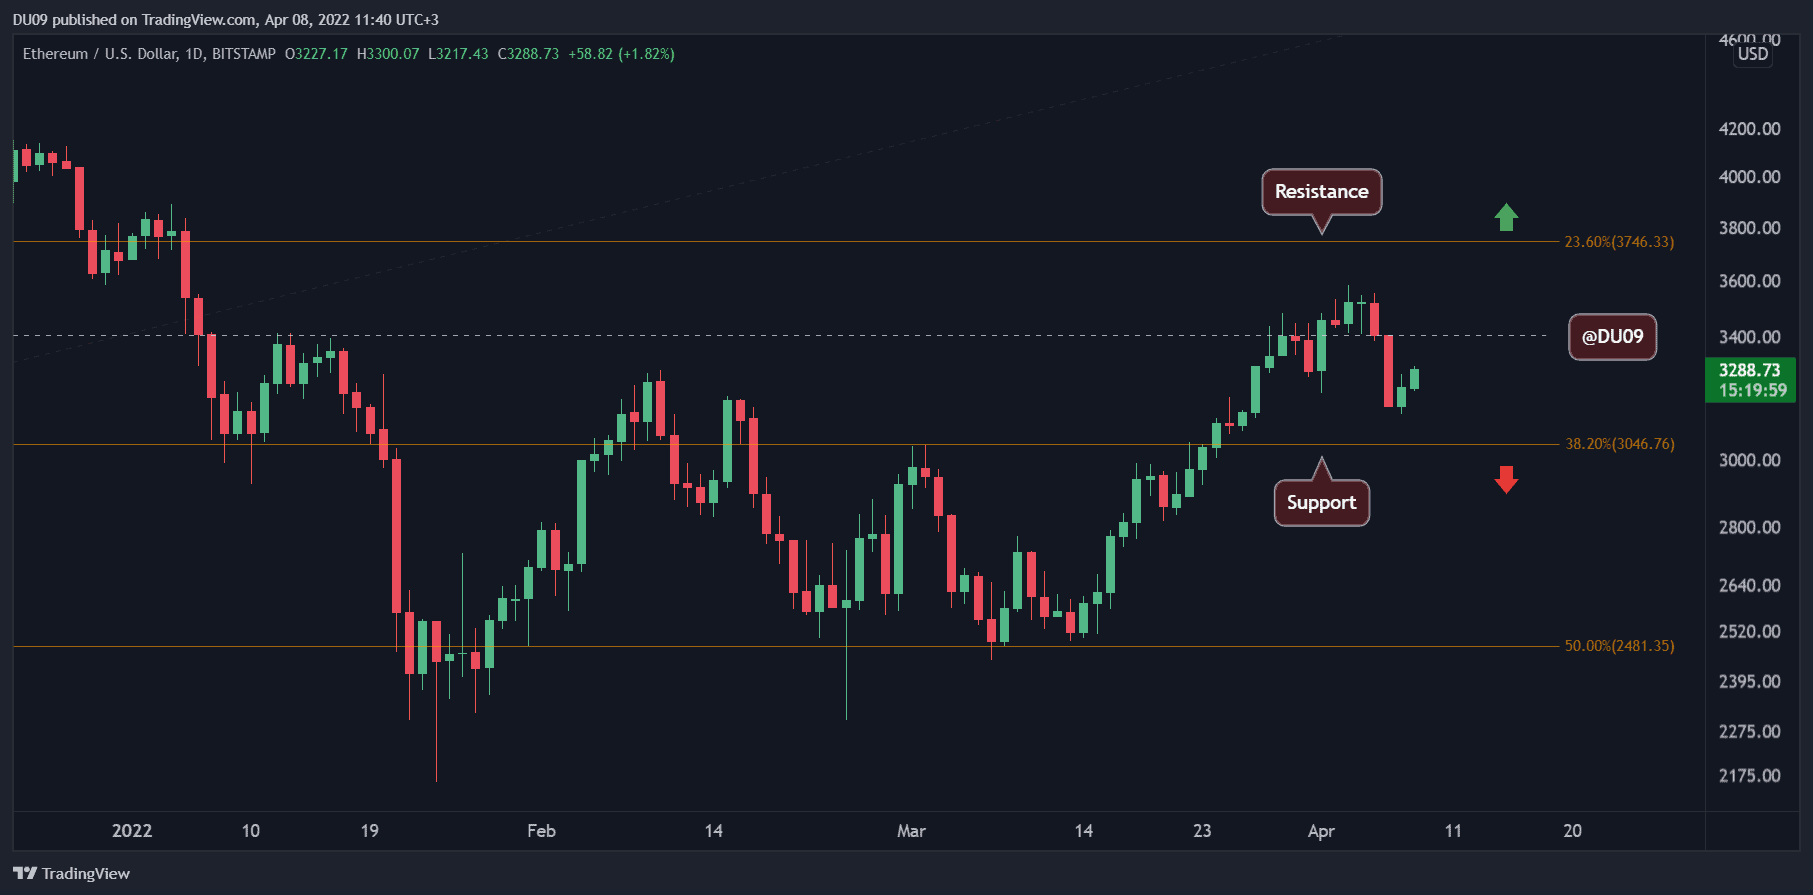
This past week, ETH has entered into a correction after reaching $3,582 (Bitstamp). The price dropped to $3,140, and in the process, the indicators have turned bearish. For this reason, ETH failed to chart any significant gains.
On shorter timeframes such as 4-hours, ETH appears keen to return towards $3,500, but sellers may have other plans for the week. The MACD on the daily has painted a bearish cross last Wednesday, and this may signal a major change in the trend.
Looking ahead, ETH has strong support just above the $3,000 level, which should be well defended by buyers. Any further drop in price is likely to be stopped at this key support which can act as a pivot for ETH to move higher again.
Cardano (ADA)
ADA closed the past seven days in red, losing 4% after it failed to push above $1.2, which is currently acting as a key resistance. Buyers attempted at least twice to move above this level, but bears did not let go of the price action, and in the past few days, they have managed to get ADA closer to $1.
The key support is found at $1, and ADA may test this level before a reversal can take place. This support is similar to the $3,000 level on the ETH chart. Unfortunately for buyers, the MACD on the daily timeframe also crossed on the bearish side last Wednesday, which is usually a sell signal.
As long as ADA can maintain a price above $1, bulls still have a very good shot to reverse the current correction and take the cryptocurrency back on the uptrend. This can then be interpreted as a healthy pullback before another leg up.

Solana (SOL)
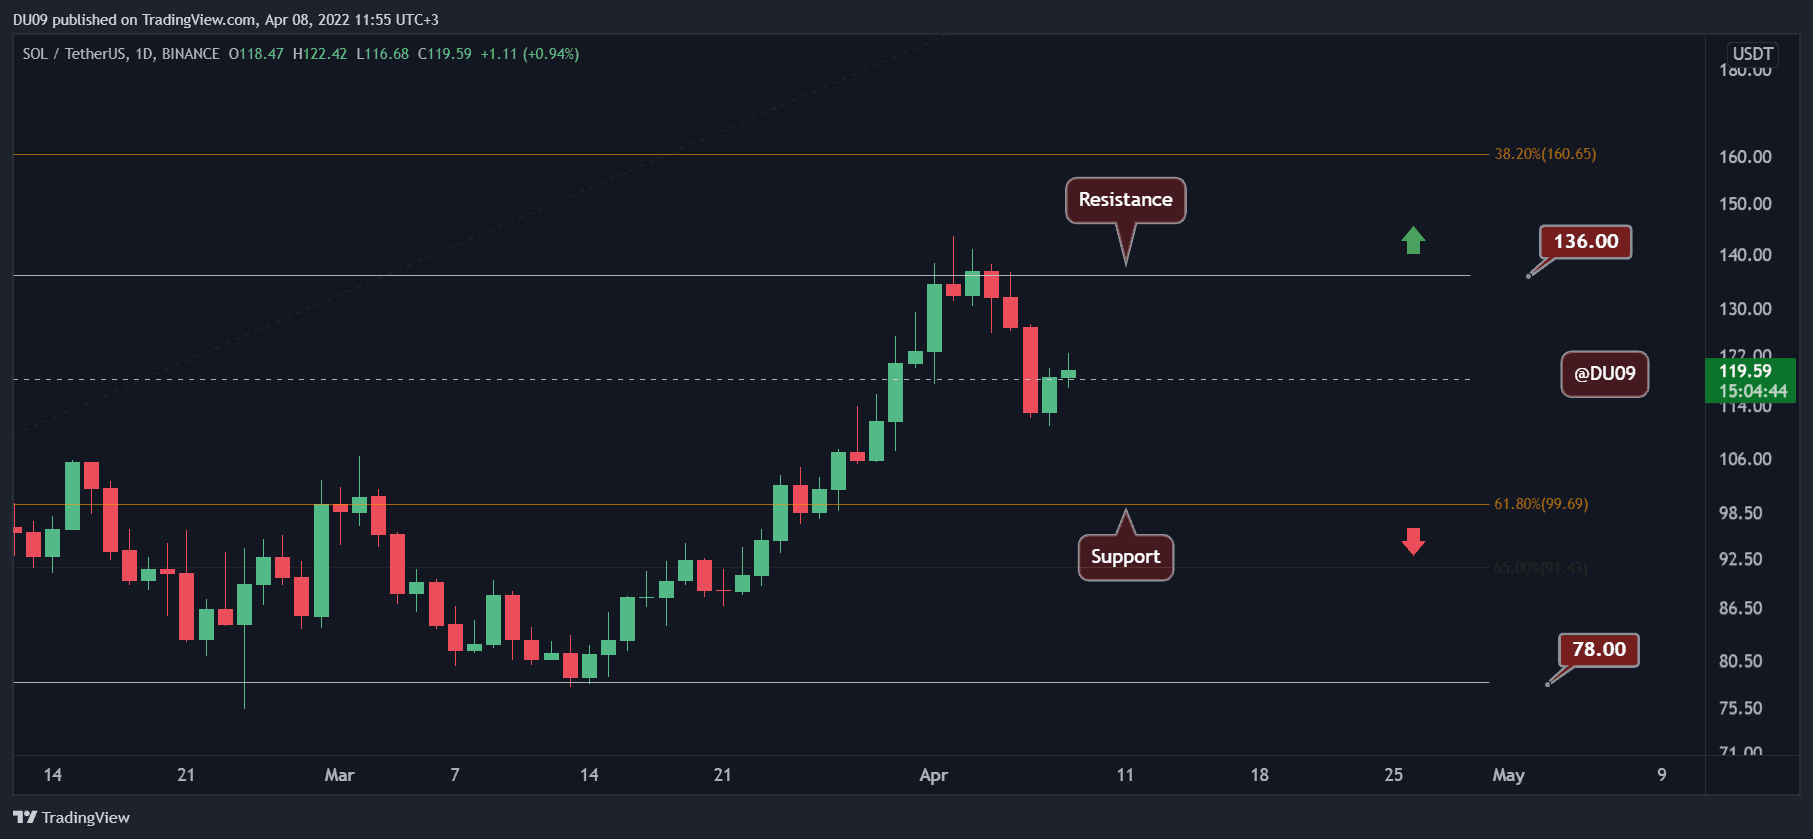
Solana was the best performer in our last analysis when it reached the key resistance at $136. This has changed now, with the price falling by almost 3% compared to seven days ago. The key support is found at $100, and SOL has managed to hold well above this level.
In contrast to ADA and ETH, Solana marked a bearish cross on the daily MACD today. This signal must be considered as it can push the price towards $100 if buyers do not step up soon. Volume has remained strong and buyers continue to be interested in SOL, but the bullish momentum has lost its strengths, opening an opportunity for sellers to take over.
Looking ahead, it is wise to not exclude a possible drop lower for SOL. Sellers could take the price to $100 before they become exhausted, and buyers will sense their opportunity to take over again.
Avalanche (AVAX)
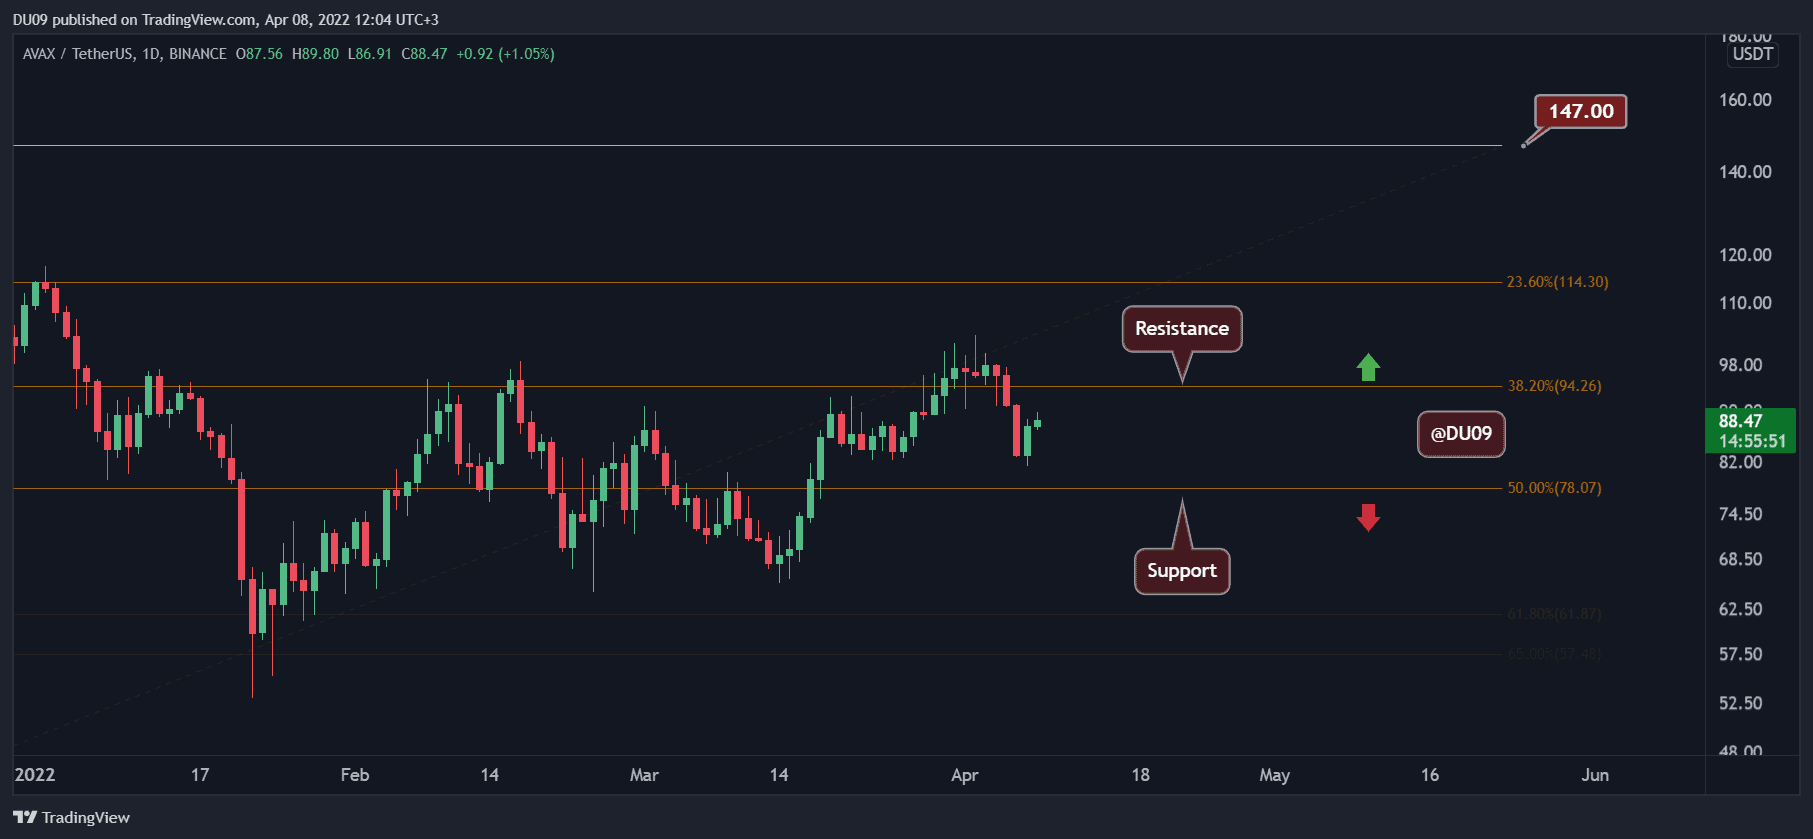
AVAX has been struggling to gather momentum and has lost 7% of its valuation in the past seven days. Despite this, the cryptocurrency manage to make higher lows each time since February, placing it in a clear bullish trend.
The key resistance is found at $100 and the support at $78. For most of the past three months, AVAX has moved inside this range, and any deviation was quickly pushed back within it. Buyers will need to gather a lot of volume and momentum to be able to break above $100 and turn that level into support. So far, they have failed to do so.
Looking ahead, AVAX is likely to bounce a bit longer between its current support and resistance until the bulls attempt another breakout. The sell-side is not in an advantageous position considering that price is found in an uptrend. Therefore the bias is bullish in the future.
Luna
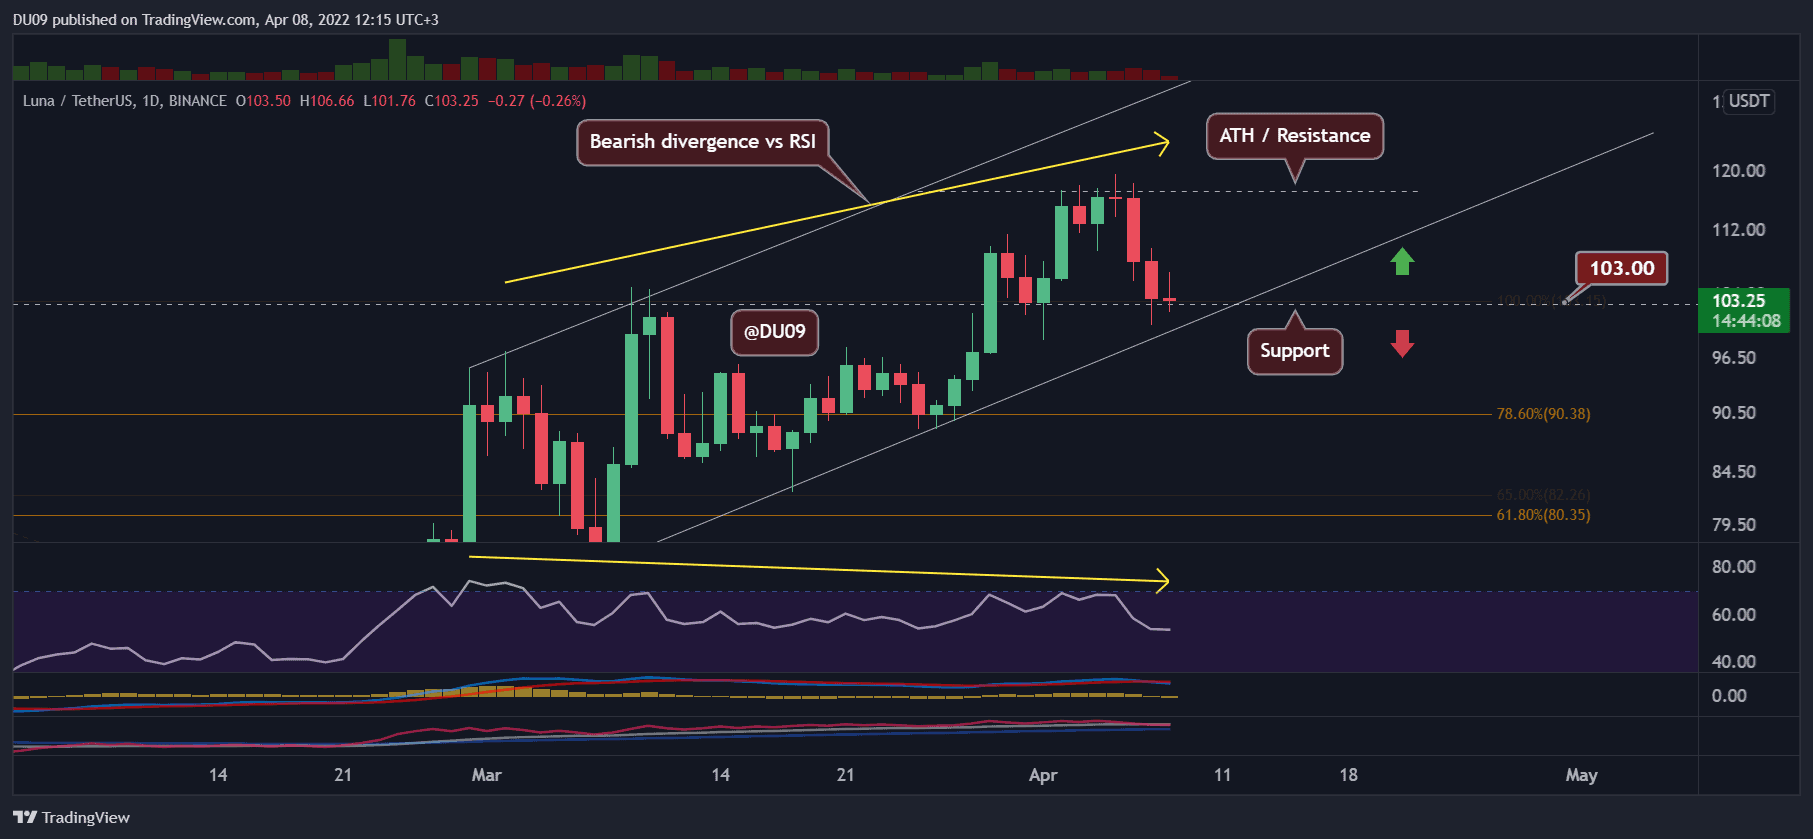
Luna had a fantastic week after it achieved a new all-time high at $119.55 (Binance). However, celebrations did not last as Luna’s price quickly reversed and entered a sustained correction falling back to $100 a few days later. This level is currently acting as support, and if lost, it would be a massive blow to bulls. This price action erased most of the gains made in the past seven days, with the price being almost identical to our last analysis.
Luna’s charm may also be fading in the near term as competition in the algorithmic stablecoins is intensifying. Yesterday, news broke out that Near Protocol will create their own algorithmic stablecoin called USN, which may mirror the Luna/UST mint/burn mechanics.
On top of this, the latest action from Luna shows a large bearish divergence between price and the RSI. While the price has been constantly making higher highs since December 2021, the RSI indicator, on the other hand, has made lower highs.
This could lead to a more significant correction for Luna in the near future. Best to be cautious because of that before considering an entry into Luna at this time.
OhNoRipple via https://www.ohnocrypto.com/ @Duo Nine, @Khareem Sudlow

