Polkadot Recovers From Downtrend but Faces Rejection Twice at $8 High
Jul 23, 2022 at 09:13 //
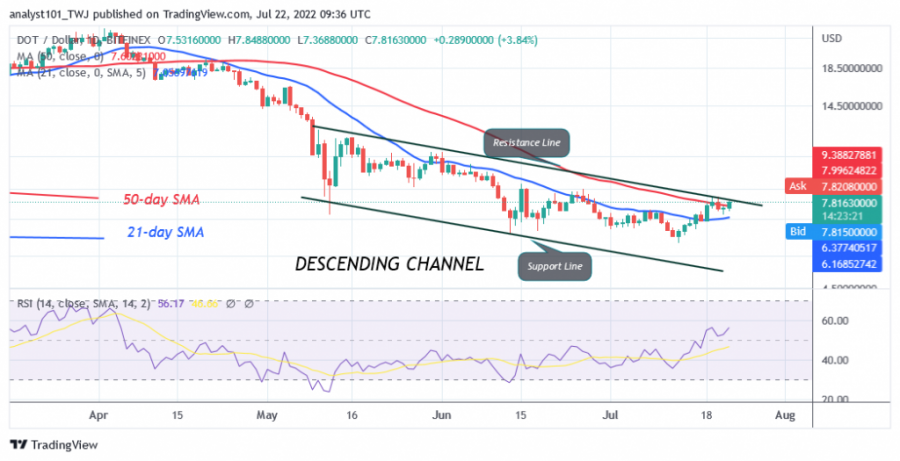
PriceOn July 16, Polkadot (DOT) broke through and retested the 21-day SMA line before resuming the uptrend. This is the first time since April 11 that the bulls broke the 21-day line SMA.
The bullish momentum has extended to the 50-day line SMA. Buyers are trying to keep the price above the 50-day line SMA. A break above the 50-day line SMA will accelerate the upward price movement. However, the price of DOT will rise and reach the previous highs, but will face resistance at the high of $8.50. Meanwhile, if the bulls fail to break the 50-day SMA line, the altcoin will decline and be forced to move between the moving average lines. Meanwhile, DOT/USD is trading at $7.80 at the time of writing.
Polkadot indicator analysis
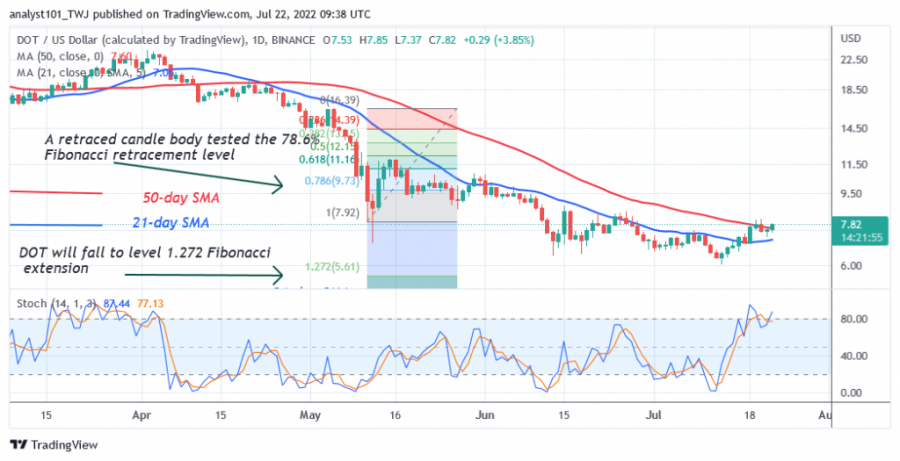
The altcoin is at level 56 of the Relative Strength Index for the period 14. DOT is in the uptrend zone and could continue to rise to the previous highs. The cryptocurrency price has broken the 50-day moving average line, but not convincingly, as it has not closed above it yet. DOT is above the 80% area of the daily stochastic. The altcoin is trading in the overbought area of the market. Sellers are likely to be attracted to the overbought region. The 21-day line SMA and the 50-day line SMA are making a reversal, indicating an uptrend.

Technical indicators:
Major Resistance Levels - $10 and $12
Major Support Levels - $6 and $4
What is the next direction for Polkadot?
Polkadot is trading in the overbought zone of the market. This suggests that the bullish momentum is reaching bearish exhaustion. Meanwhile, the May 11 downtrend has shown a candle body testing the 78.6% Fibonacci retracement level. The retracement suggests that the price of DOT will fall to the level of the Fibonacci extension of 1.272 or to the level of $5.61.

Disclaimer. This analysis and forecast are the personal opinions of the author and are not a recommendation to buy or sell cryptocurrency and should not be viewed as an endorsement by CoinIdol. Readers should do their research before investing funds.
OhNoCryptocurrency via https://www.ohnocrypto.com/ @coinidol.com By Coin Idol, @Khareem Sudlow
