Ripple Price Analysis: This is The Next Level XRP Bulls Eye
Following our most recent Ripple price analysis, XRP successfully maintained the significant 30 cents support area and went through a higher low. However, we will need to see a higher high over the next short term to form a bullish structure.
Technical Analysis
Technical Analysis By Grizzly
The Daily Chart
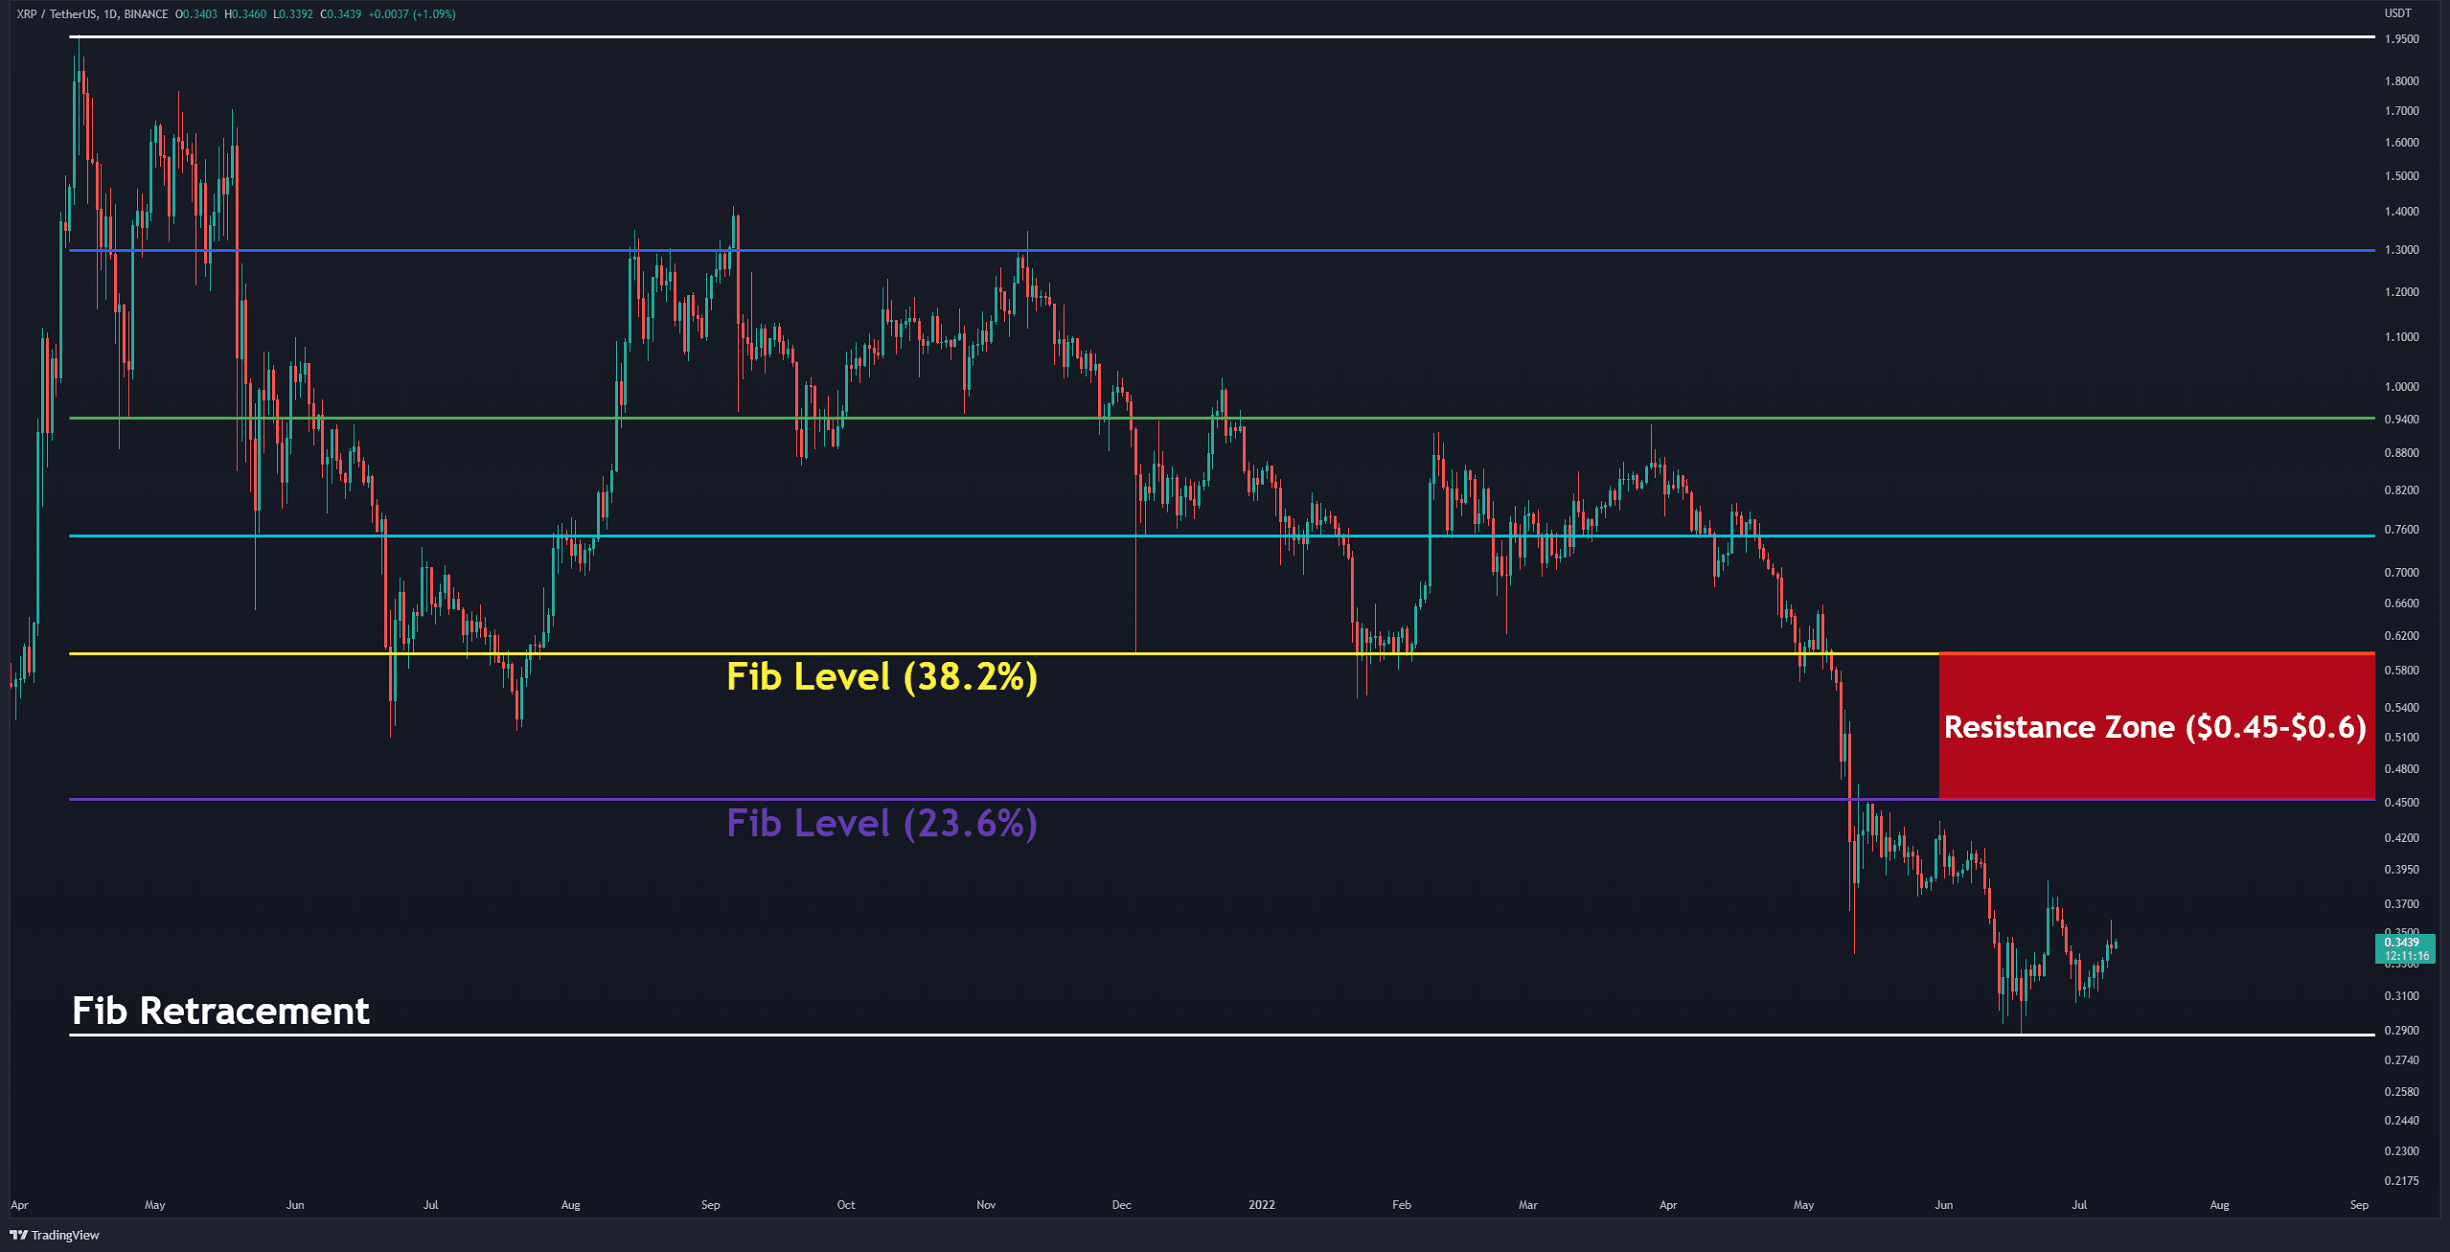
On the daily timeframe, buyers are attempting to dominate the market.
By adding the Fibonacci Retracement levels to the following chart, the resistance zone between 23.6% (in purple) and 38.2% (in yellow) can be considered the first major challenge for XRP. This zone ranges between $0.45 to $0.6.
Considering the deep crash that has occurred over the recent months, breaking this area may not be easy because the strong supports have turned into resistance during the drop. On the other hand, if $0.3 breakdown, then $0.24 is the next significant support level.
Key Support Levels: $0.30 & $0.24
Key Resistance Levels: $0.45 & $0.60
MA20: $0.33
MA50: $0.36
MA100: $0.50
MA200: $0.63
The XRP/BTC Chart
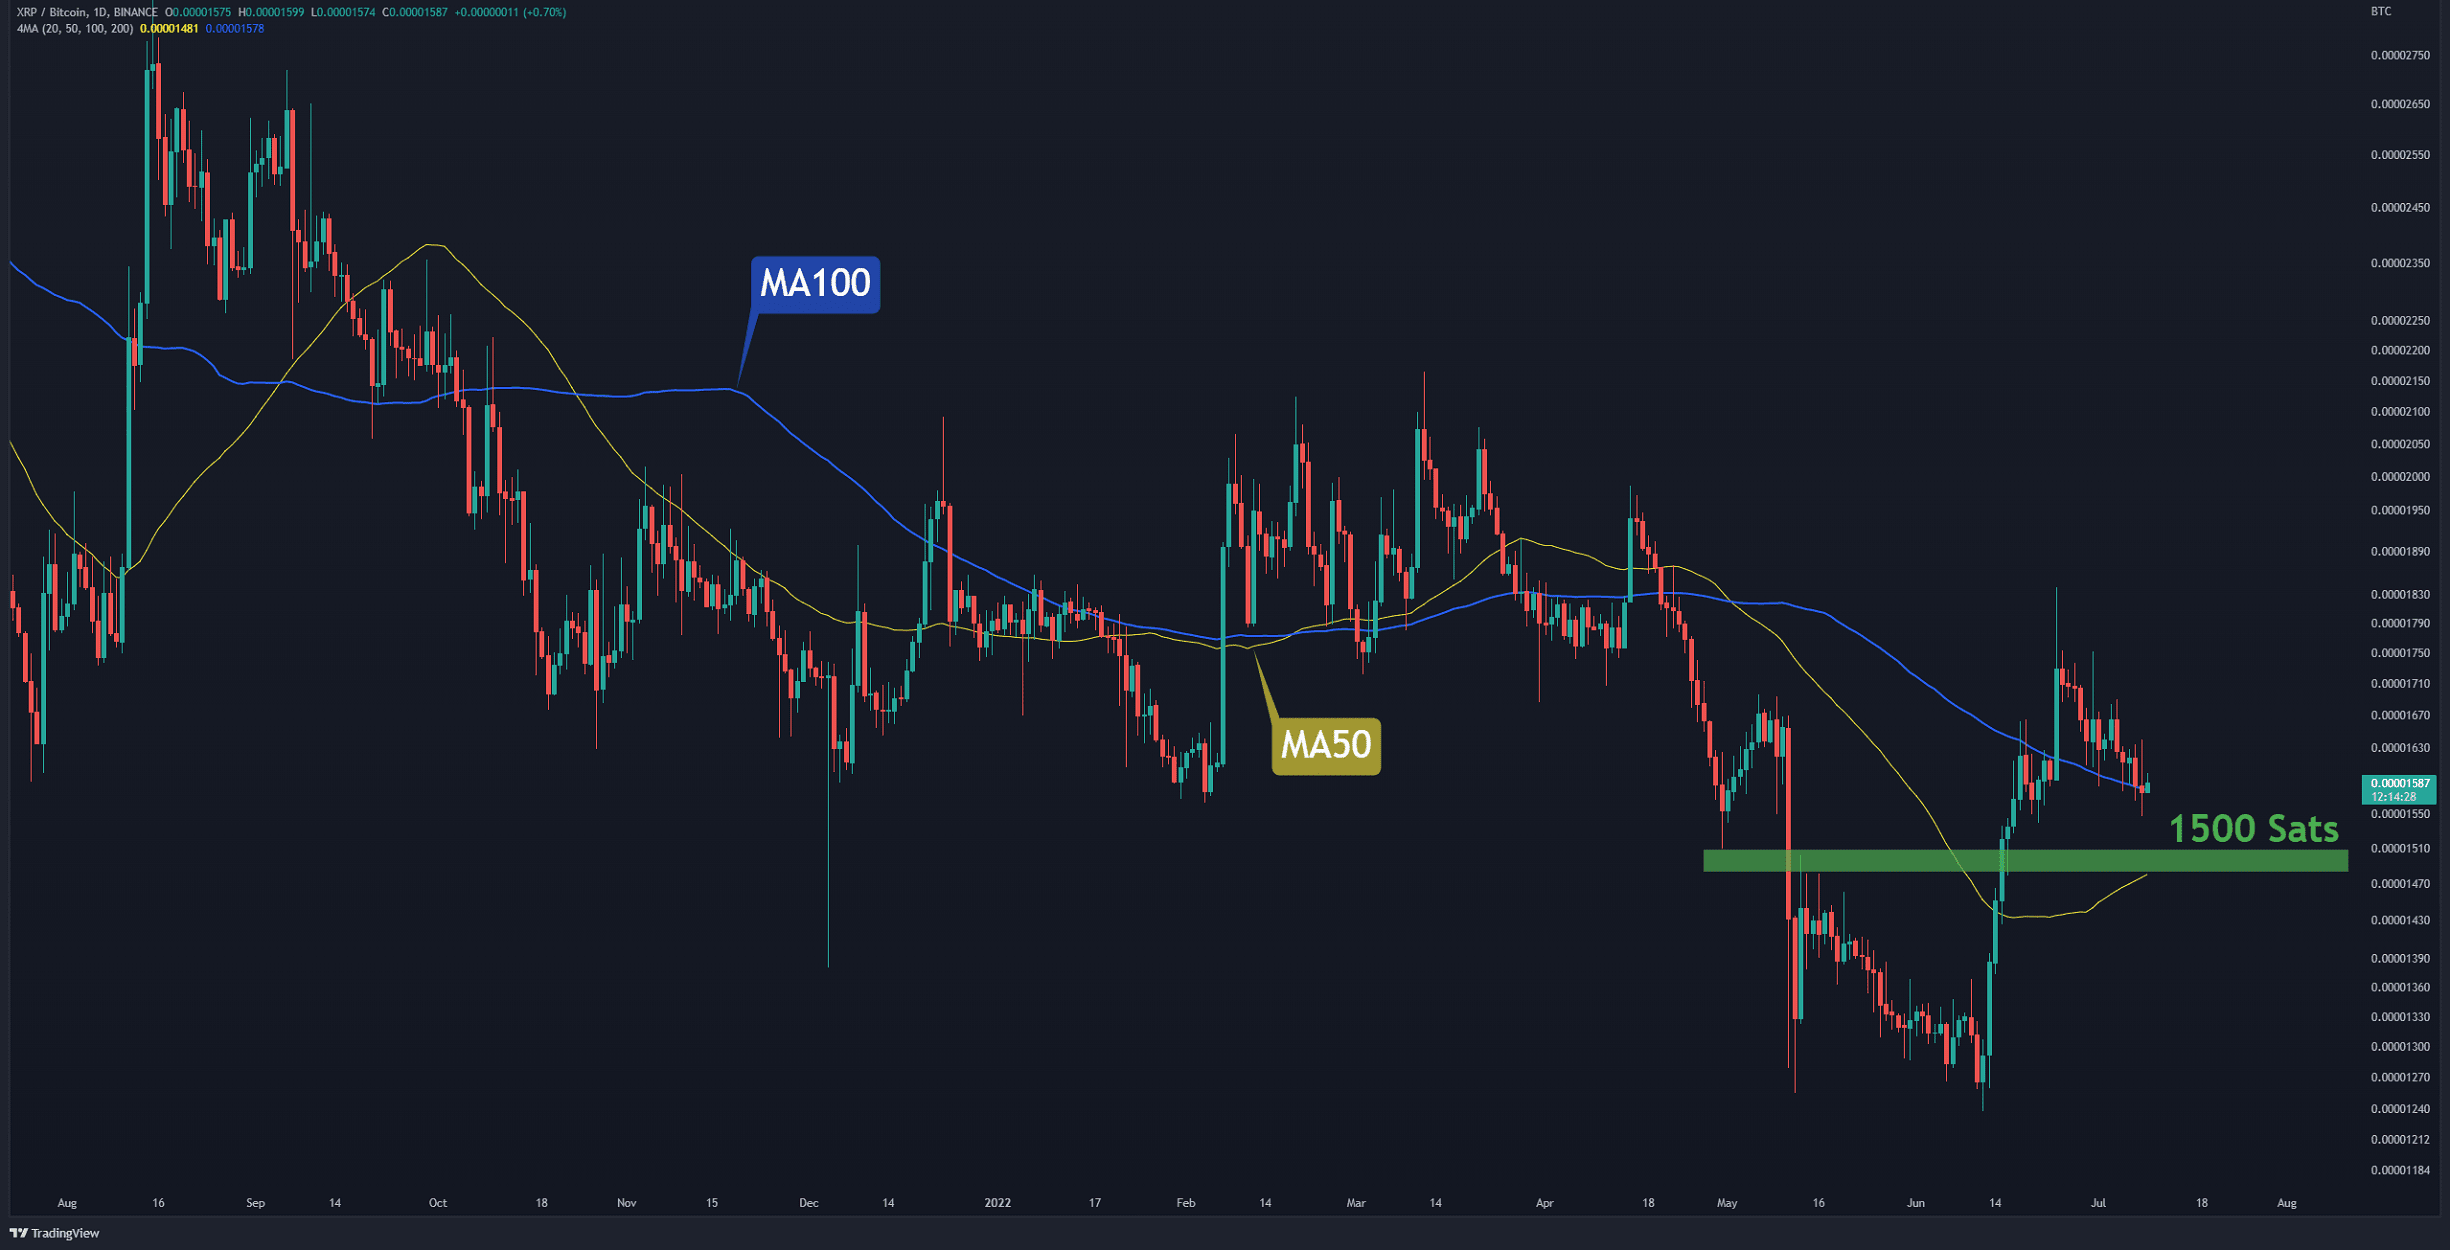
On the BTC trading pair chart, the 100-DMA (in blue) is currently acting as support. Bears have managed to correct 14% of the mid-June bullish trend downwards.
The intersection of the daily 50-day MA (in yellow) and the horizontal support at 1500 SATs (in green) can be marked as a possible area for support. If the latter level is maintained, there is a high chance of seeing the 1700-1800 SATs level get retested.
Key Support Levels: 1500 SATs & 1250 SATs
Key Resistance Levels: 1700 SATs & 1800 SATs
OhNoRipple via https://www.ohnocrypto.com/ @CryptoVizArt, @Khareem Sudlow


