This is the Level XRP Needs to Break to Confirm a Bullish Reversal (Ripple Price Analysis)
After touching the long-term support at $0.3, Ripple entered into a rally and added 22% to its price. However, the bearish structure is still looming unless this rally breaks above its next major resistance.
Technical Analysis
By Grizzly
The Daily Chart:
Finally, XRP bulls were able to overcome the selling pressure. After several attempts, they accomplished a breakout from the descending line (in yellow). The MACD indicator, which has shown a positive divergence (in green) for nearly two months, is approaching the baseline and the histogram bars are entirely green. This structure means that bullish momentum dominates the market.
On the other hand, the horizontal resistance at $0.4 (in red) is a major challenge for Ripple. The bulls should be able to break above this monthly consolidation phase. In this case, the currently forming bullish structure in MACD will have a higher chance to remain sustainable for the mid-term.
Key Support Levels: $0.30 & $0.24
Key Resistance Levels: $0.40 & $0.48

Moving Averages:
MA20: $0.33
MA50: $0.35
MA100: $0.45
MA200: $0.61
The XRP/BTC chart
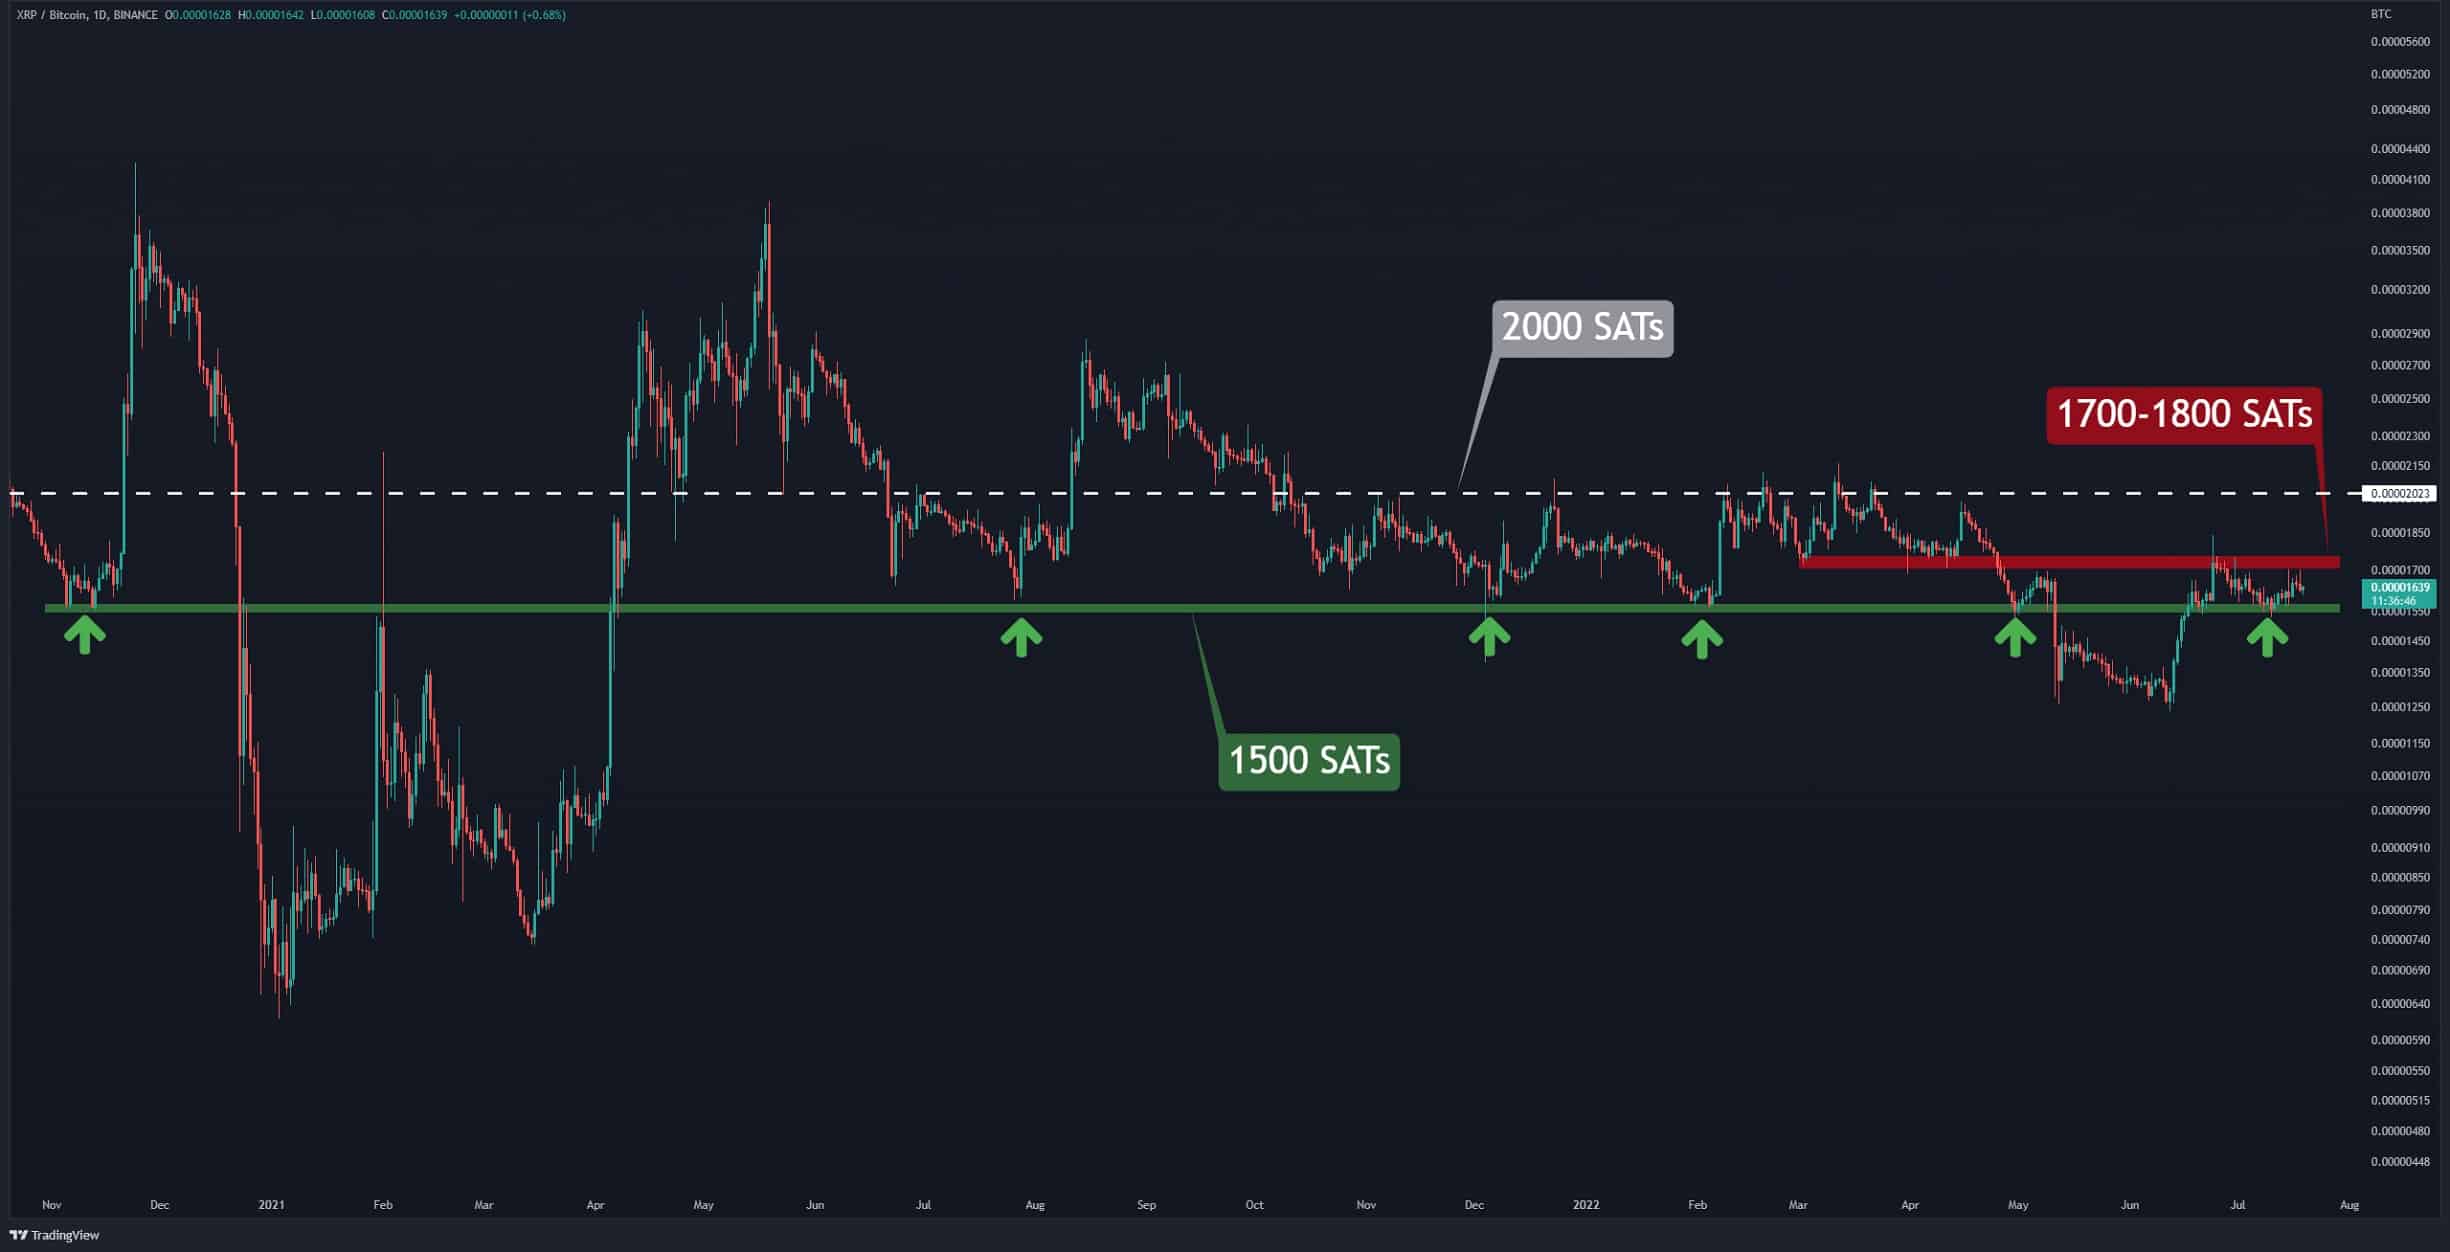
Against Bitcoin, the cryptocurrency is trading above the critical support at 1,500 SATs (in green). This level has repeatedly prevented the price from dropping. The buyers have defended it in the past few days, but on the opposite side, the sellers have prevented the price to increase further by building a sell wall in the range of 1700-1800 SATs. If the bulls break this barrier in their next attempt., this would confirm the trend reversal, and the resistance at 2000 SATs (in white) will likely be tested.
Key Support Levels: 1500 SATs & 1250 SATs
Key Resistance Levels: 1800 SATs & 2000 SATs

OhNoRipple via https://www.ohnocrypto.com/ @CryptoVizArt, @Khareem Sudlow
