Weekly Cryptocurrency Market Analysis: Altcoins Decline as Cryptos Show No Strength at Higher Price Levels
Aug 18, 2022 at 12:00 //
PriceThe cryptocurrencies listed below are in a downward correction as buyers fail to sustain bullish momentum above the moving average lines. The bottom line is that these worst performing cryptocurrencies risk a decline to their previous lows.
Decred
The price of Decred (DCR) is trading in the uptrend zone. The cryptocurrency has retreated above the moving average lines after the recent price increase. If the coin holds above the moving average lines, the uptrend will resume and resistance at $64 will be reached. On the other hand, if the price breaks below the moving average lines, selling pressure will resume.
DCR will continue to fall to a low of $26. Meanwhile, the altcoin is at level 51 of the Relative Strength Index for period 14, indicating that there is a balance between supply and demand. It is the cryptocurrency asset with the lowest performance this week. It has the following characteristics:
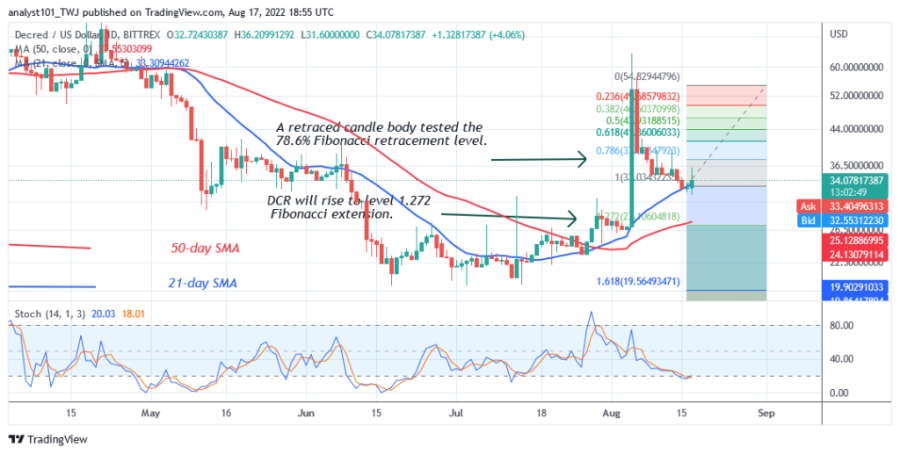
Price: $32.23
Market capitalization: $678,160,209
Trading volume: $11,226,244
7-day loss: 12.34%
Oasis Network
Oasis Network (ROSE) is trading in the zone of uptrend as the price is above the moving average lines. On August 8, ROSE rallied to a high of $0.11 but was pushed back. The cryptocurrency has pulled back above the moving average lines. Selling pressure will continue if the bears break below the moving average lines. ROSE will decline and fall into the $0.04 to $0.08 range. If the altcoin holds above the moving average lines, it will regain the previous highs of $0.11. A break above the recent high will drive the altcoin to the highs of $0.14 or $0.20.
Meanwhile, the altcoin is at level 53 on the Relative Strength Index for the period of 14. ROSE is in uptrend territory and could continue to rise. It is the cryptocurrency with the second worst performance this week. It has the following characteristics:
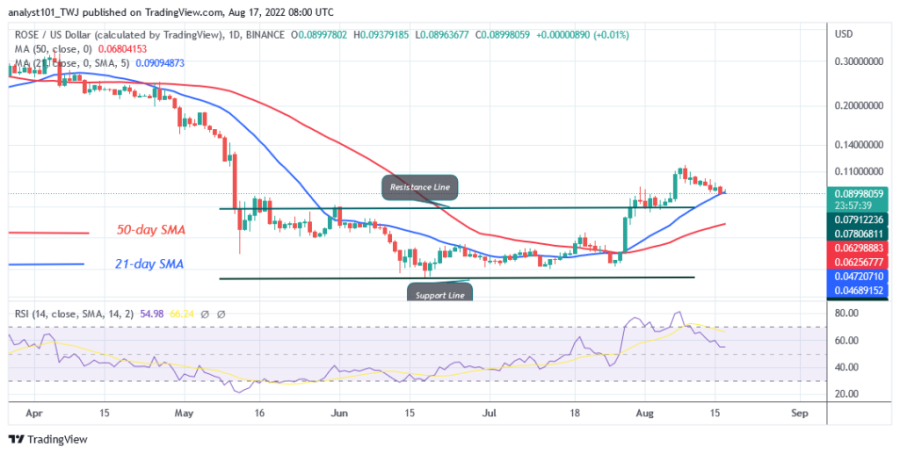
Price: $0.08885
Market capitalization: $888,534,654
Trading volume: $52,234,502
7-day loss: 9.73%
Maker
Maker (MKR) is in a downtrend as the price is falling below the moving average lines. The implication is that the altcoin will fall and could regain the previous low. Today, MKR falls to the low of $964.88, which is an oversold region of the market. This means that further selling pressure is unlikely.
MKR is below the 20% range of the daily stochastic. This indicates that the market has reached the oversold region. Buyers are expected to emerge to push prices higher. However, MKR is the cryptocurrency with the third worst performance this week. It has the following characteristics:
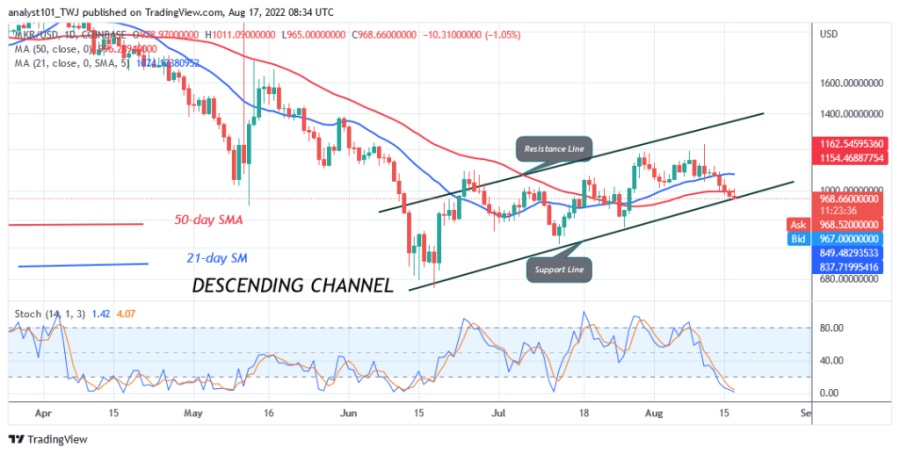
Price: $975.80
Market capitalization: $981,241,428
Trading volume: $252,162,228
7-day loss: 8.42%
Mina
The price of Mina (MINA) is in an upward correction as the altcoin has risen to the high of $0.99. MINA has also retested the historical price level from May 31. The cryptocurrency has been met with resistance as it reaches an overbought region of the market. Sellers have emerged in the overbought region of the market, pushing prices lower. The cryptocurrency value has declined and fallen below the 21-day line SMA.
The altcoin is falling as it approaches the 50-day line SMA. On the downside, if the altcoin declines and holds above the 50-day line SMA, the cryptocurrency value will continue its movement between the moving average lines. MINA will regain the previous lows of $0.60 and $0.63 if the bears fall below the moving average lines. It is the cryptocurrency with the fourth worst performance this week. It has the following characteristics:
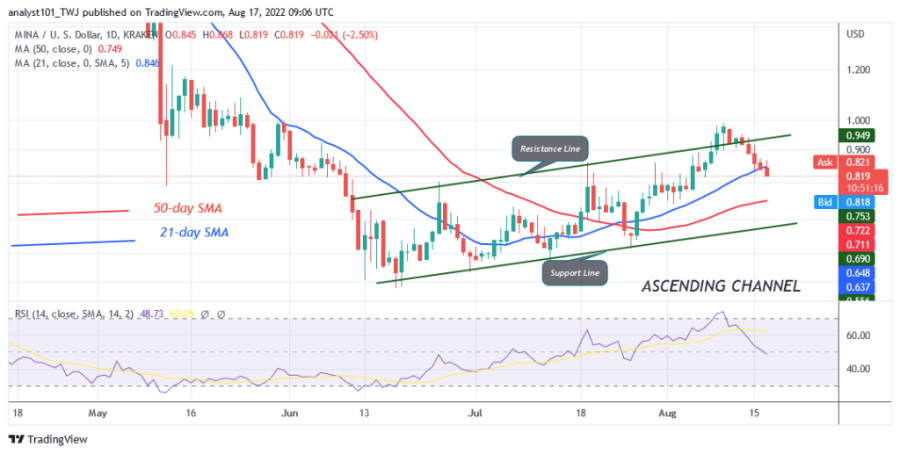
Price: $0.8132
Market capitalization: $680,491,732
Trading Volume: $22,922,967
7-day loss: 8.01%
The Graph
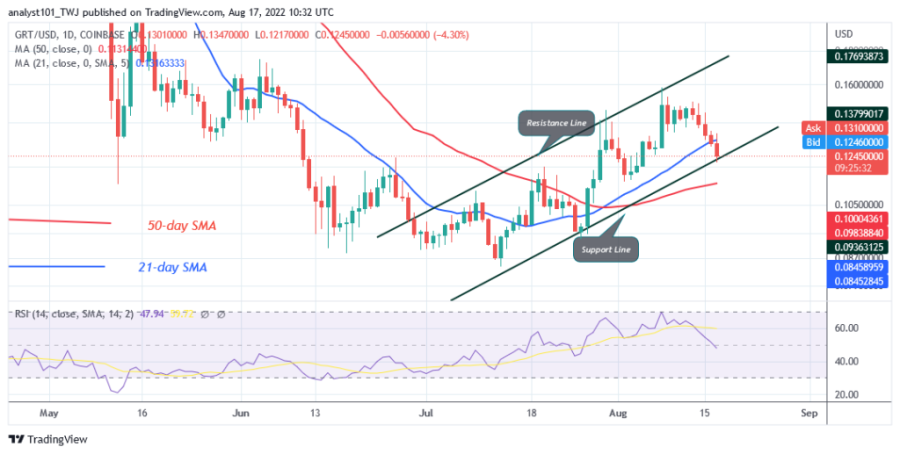
The Graph (GRT) is in an uptrend and rose to the high of $0.158. Buyers failed to sustain the bullish momentum above the recent high as the altcoin retreated. The cryptocurrency has dropped below the 21-day line SMA while approaching the 50-day line SMA. On the downside, the altcoin will fall and find support above the 50-day line SMA. However, the cryptocurrency will regain the previous low at $0.09 if the bears fall below the 50-day line SMA.
Meanwhile, GRT is at level 47 on the Relative Strength Index for period 14, indicating that the altcoin is in the downtrend zone and could fall further. It is the cryptocurrency asset with the fifth worst performance this week. It has the following characteristics:
Price: $0.1239
Market capitalization: $1,246,392,512
Trading volume: $169,713,632
7-day loss: 6.02%
Disclaimer. This analysis and forecast are the personal opinions of the author and are not a recommendation to buy or sell cryptocurrency and should not be viewed as an endorsement by Coin Idol. Readers should do their own research before investing funds.
OhNoCryptocurrency via https://www.ohnocrypto.com/ @coinidol.com By Coin Idol, @Khareem Sudlow
