Litecoin is Stable but Remains Stuck Under $64 Overhead Resistance
Sep 13, 2022 at 10:30 //
PriceLitecoin (LTC) price is in an uptrend while fighting against the resistance at $64.
Long-term forecast of the Litecoin price: Bearish
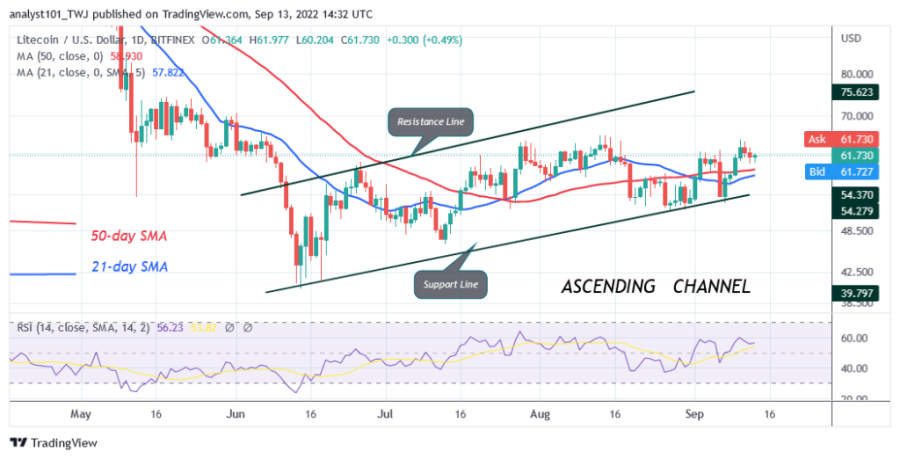
Since September 2, the price movement has remained the same. Buyers have tried to keep the price above the $62 and $64 levels but have been rejected many times. After the rejection, the cryptocurrency will go back above the moving average lines or the low of $60 and continue a sideways movement. A break above the resistance levels will drive the altcoin to the high of $71.53.
Nevertheless, the upward movement is doubtful because there are small indecisive candlesticks called doji. These candlesticks are responsible for the current sideways movement. On the downside, Litecoin will fall above the moving average lines if it is rejected at the recent high. However, LTC/USD will continue to fall to the previous low at $52 if the bears break below the moving average lines. Meanwhile, Litecoin is trading at $61.83 at the time of writing.
Litecoin indicator analysis
Litecoin is at level 56 of Relative Strength for the period 14. The altcoin is in the bullish trend zone and could continue to rise. The price bars of LTC are above the moving average lines, indicating a possible upward movement. The cryptocurrency asset is above the 25% area of the daily stochastic. Litecoin is in a bullish momentum.

Technical Indicators:
Key resistance levels - $200 and $250
Key support levels - $100 and $50
What is the next move for Litecoin?
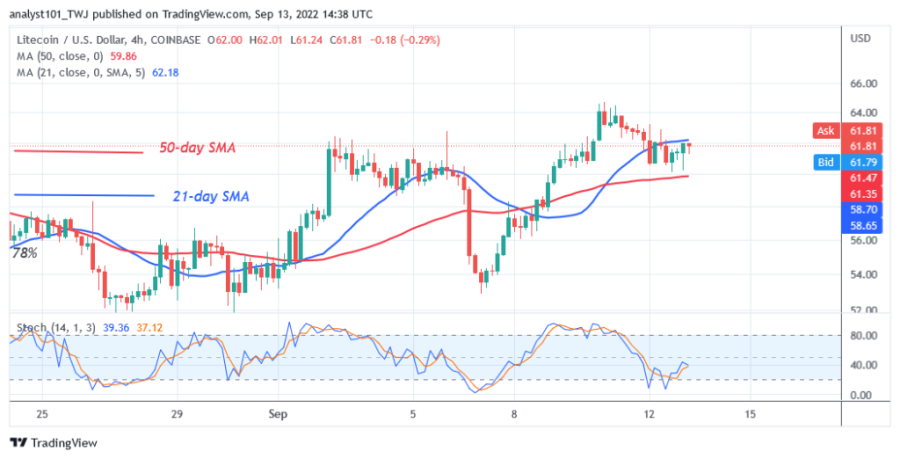
On the 4-hour chart, Litecoin is about to make an upward correction. The LTC price is below the 21-day line SMA. It is likely that the cryptocurrency will start a new trend if the area is broken. In the meantime, Litecoin is in a sideways movement between the moving average lines.

Disclaimer. This analysis and forecast are the personal opinions of the author and are not a recommendation to buy or sell cryptocurrency and should not be viewed as an endorsement by CoinIdol. Readers should do their own research before investing in funds.
OhNoCryptocurrency via https://www.ohnocrypto.com/ @coinidol.com By Coin Idol, @Khareem Sudlow
