Weekly Cryptocurrency Market Analysis: Altcoins Will Continue Their Downward Trend as Bears Keep Selling
Sep 17, 2022 at 10:30 //
PriceBitcoin has dropped to the psychological price level of $20,000. The largest cryptocurrency failed to stay in the overbought region of the market. Sellers appeared in the overbought region to resume selling pressure.
Similarly, altcoins are falling back to the previous lows after failing to break their respective recent highs. Let us discuss the underperforming cryptocurrencies in detail:
Helium
The price of Helium (HNT) is in a downtrend, dropping to the low of $4.06. The cryptocurrency is retesting the current support from August 29. The downtrend will continue if the current support is broken. Nevertheless, HNT is retesting the historical price level from February 15, 2021. In February 2021, the price level of HNT was held as it resumed its uptrend. Today, the cryptocurrency asset has fallen into the oversold zone of the market. Meanwhile, the altcoin is below the 20% area of the daily stochastic. The market has reached the oversold area. Further selling pressure is unlikely. It is the cryptocurrency asset with the lowest performance this week. It has the following characteristics:
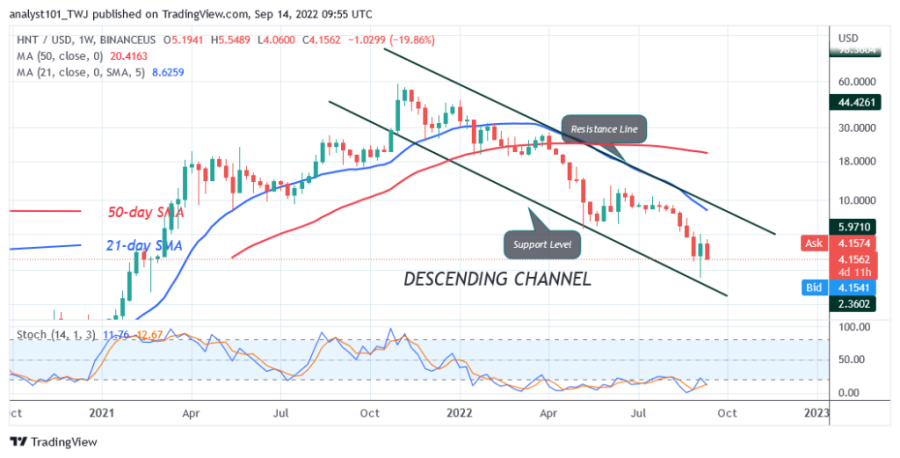
Price: $4.15
Market capitalization: $914,129,002
Trading volume: $21,501,400
7-day loss: 22.36%
EOS
EOS (EOS) is in a downtrend as the bears try to break below the moving average lines. The uptrend could not be sustained as buyers were rejected at the $1.80 resistance level. Selling pressure will resume if the price breaks below the moving average lines. EOS is below the 20% area of the daily stochastic. The market has reached the oversold area. Selling pressure may be easing. EOS, however, is the cryptocurrency with the second worst performance this week. It has the following characteristics:
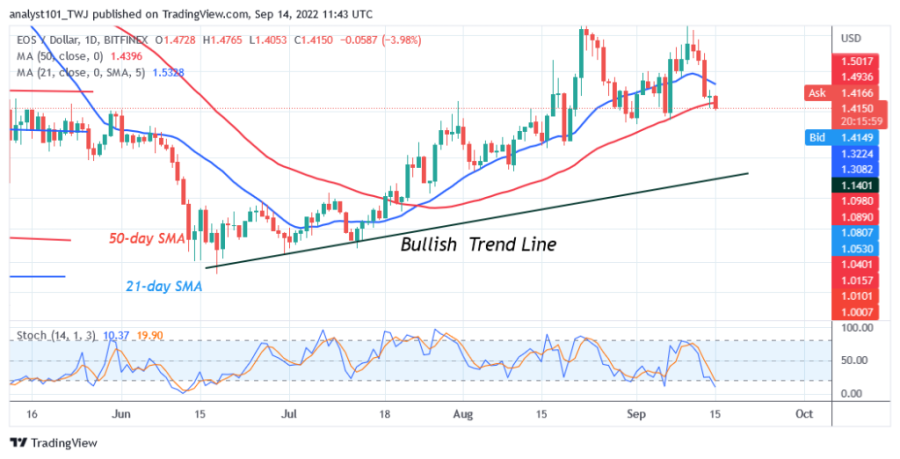
Price: $1.42
Market capitalization: $1,506,287,492
Trading volume: $406,901,002
7-day loss: 14.04%.
Lido DAO
The price of Lido DAO (LDO) resumed its downward correction as the price falls below the moving average lines. The cryptocurrency was previously in an uptrend, but the upward movement was terminated at the $3.00 resistance level. It is believed that the uptrend has ended as the price falls below the moving average lines and the uptrend line. Lido DAO is likely to fall downwards. It could fall further to the low of $1.40. Meanwhile, the altcoin is below the 20% area of the daily stochastic. The market has reached the oversold area. The selling pressure is likely to ease. It is the cryptocurrency asset with the third worst performance this week. It has the following characteristics:
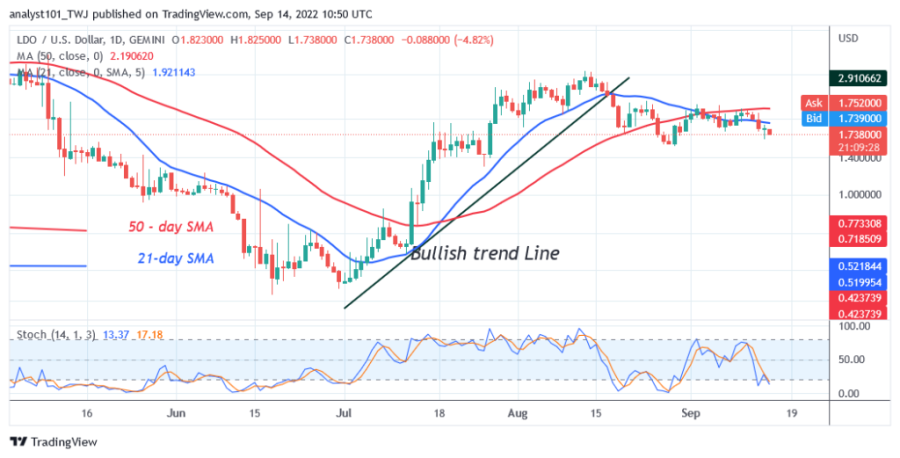
Price: $1.70
Market capitalization: $1,698,208,154
Trading volume: $113,001,720
7-day loss: 8.53%
Curve DAO Token
Curve DAO Token (CRV)) Price is in a downward correction as the price breaks below the moving average lines. The cryptocurrency asset was previously in an uptrend when it reached the high of $1.58. The uptrend ended when the price broke below the moving average lines. Nevertheless, the altcoin will continue to decline as it faces a rejection of the recent high. On September 11, the altcoin faced another rejection as selling pressure resumed. Meanwhile, the August 20 downtrend has shown a candle body testing the 61.8% Fibonacci retracement level. The retracement suggests that CRV will fall to the 1.618 Fibonacci Extension level or $0.67. The altcoin is at level 45 of the Relative Strength Index for the period 14, indicating that it is in a downtrend and could continue to fall. It is the cryptocurrency asset with the fourth worst performance this week. It has the following characteristics:
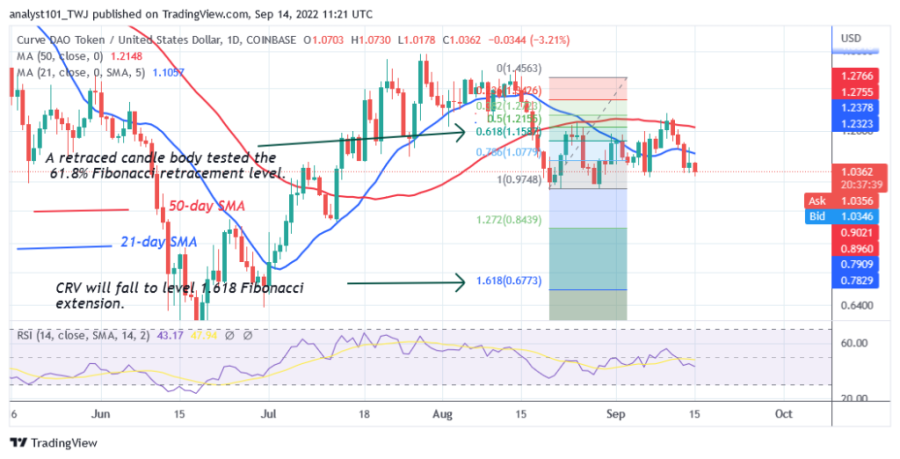
Price: $1.03
Market capitalization: $3,412,950,971
Trading volume: $117,564,813
7-Day loss: 8.51%
Synthetix
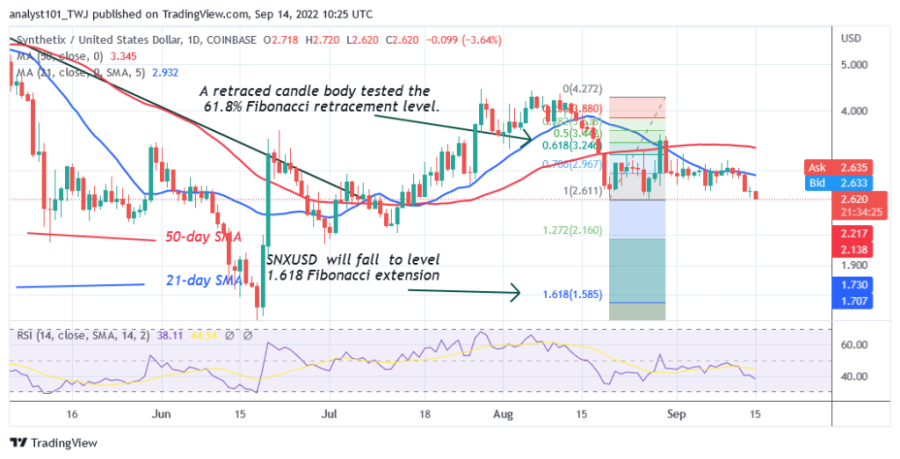
Synthetix (SNX) is in a downtrend as the altcoin is experiencing a rejection at the 21-day line SMA. As a result, SNX is vulnerable to another downtrend. In July and August, buyers tried to keep the price above the upper resistance of $4.00, but were rejected. Today Synthetix fell below the moving average lines and resumed its downtrend. Meanwhile, the August 20 downtrend has shown a candle body testing the 61.8% Fibonacci retracement level. The retracement suggests that SNX will fall to the 1.618 Fibonacci extension level or $1.58. The price action shows that the altcoin is falling back to the previous low of June 18. The altcoin is at level 38 of the Relative Strength Index for the period 14, indicating that it is in a downtrend and could continue to fall. It is the cryptocurrency asset with the fifth worst performance this week. It has the following characteristics:
Price: $2.64
Market capitalization: $769,444,665
Trading volume: $58,074,818
7-day loss: 9.31%
Disclaimer. This analysis and forecast are the personal opinions of the author and are not a recommendation to buy or sell cryptocurrency and should not be viewed as an endorsement by Coin Idol. Readers should do their own research before investing in funds.
OhNoCryptocurrency via https://www.ohnocrypto.com/ @coinidol.com By Coin Idol, @Khareem Sudlow
